



Finance asks why two Power BI reports show different numbers for the same KPI. An analyst sets aside new work to trace each figure back to its model. A few days later, a change to a shared measure sends that analyst back into reports that used to work. Those hours come out of the same budget that pays for new analysis.
Anaconda’s 2020 survey found that respondents spent an average of 45% of their time preparing data. At an annual salary of $120,230, that share is worth about $54,100 in paid time. Some preparation belongs in every analyst’s week. For a CFO or BI manager, the budget question is how much time the team spends doing the same work again because reports use different definitions or changes go unnoticed. The surveys below measure preparation time, so the case for recovering those hours depends on what your team finds in its own records.
Data analyst productivity starts with where the hours go
Anaconda surveyed 2,360 people in more than 100 countries in 2020. On average, respondents said they spent 45% of their time loading and cleaning data before they could build models or visuals. The survey covered people in several roles and industries, so the average describes a wider group than BI analysts alone.
An older survey gives a BI-specific view. In 2015, data software vendor Xplenty surveyed more than 200 BI professionals. One in three said they spent 50–90% of their time cleaning raw data. When asked what made preparation difficult, 55% cited bringing data together from different platforms. Another 39% cited work on incoming data, such as cleaning it or changing its format.
What the productivity gap costs
Salary overhead
The U.S. Bureau of Labor Statistics puts the median annual wage for data scientists at $120,230 in May 2025. That figure serves as a stand-in for the calculation below. A BI manager can use the team’s actual salaries to price the share of time logged against each task.
At 45%, the example comes to about $541,000 in salary time for a team of ten. A fully loaded labor estimate can include employer-paid benefits and payroll costs. To estimate how much time the team could recover, the calculation has to use the share spent on avoidable work. The table prices all preparation time, including work the team would still need to do.
Delayed decisions
When two reports disagree, the analyst has to settle which figure the business should use. The decision may wait for that answer, or someone may go ahead with a number the team has yet to check. The time log captures the hours spent on the review. The gap between the original request and the verified answer shows how long the business had to wait.
Missed strategic signals
Time spent repairing last month’s report is time the analyst could spend looking at next quarter’s churn. The surveys put no dollar figure on work that gets pushed aside. A team can still track which planned analyses were delayed and use that list to decide where recovered time would go.
Why ungoverned BI creates extra work
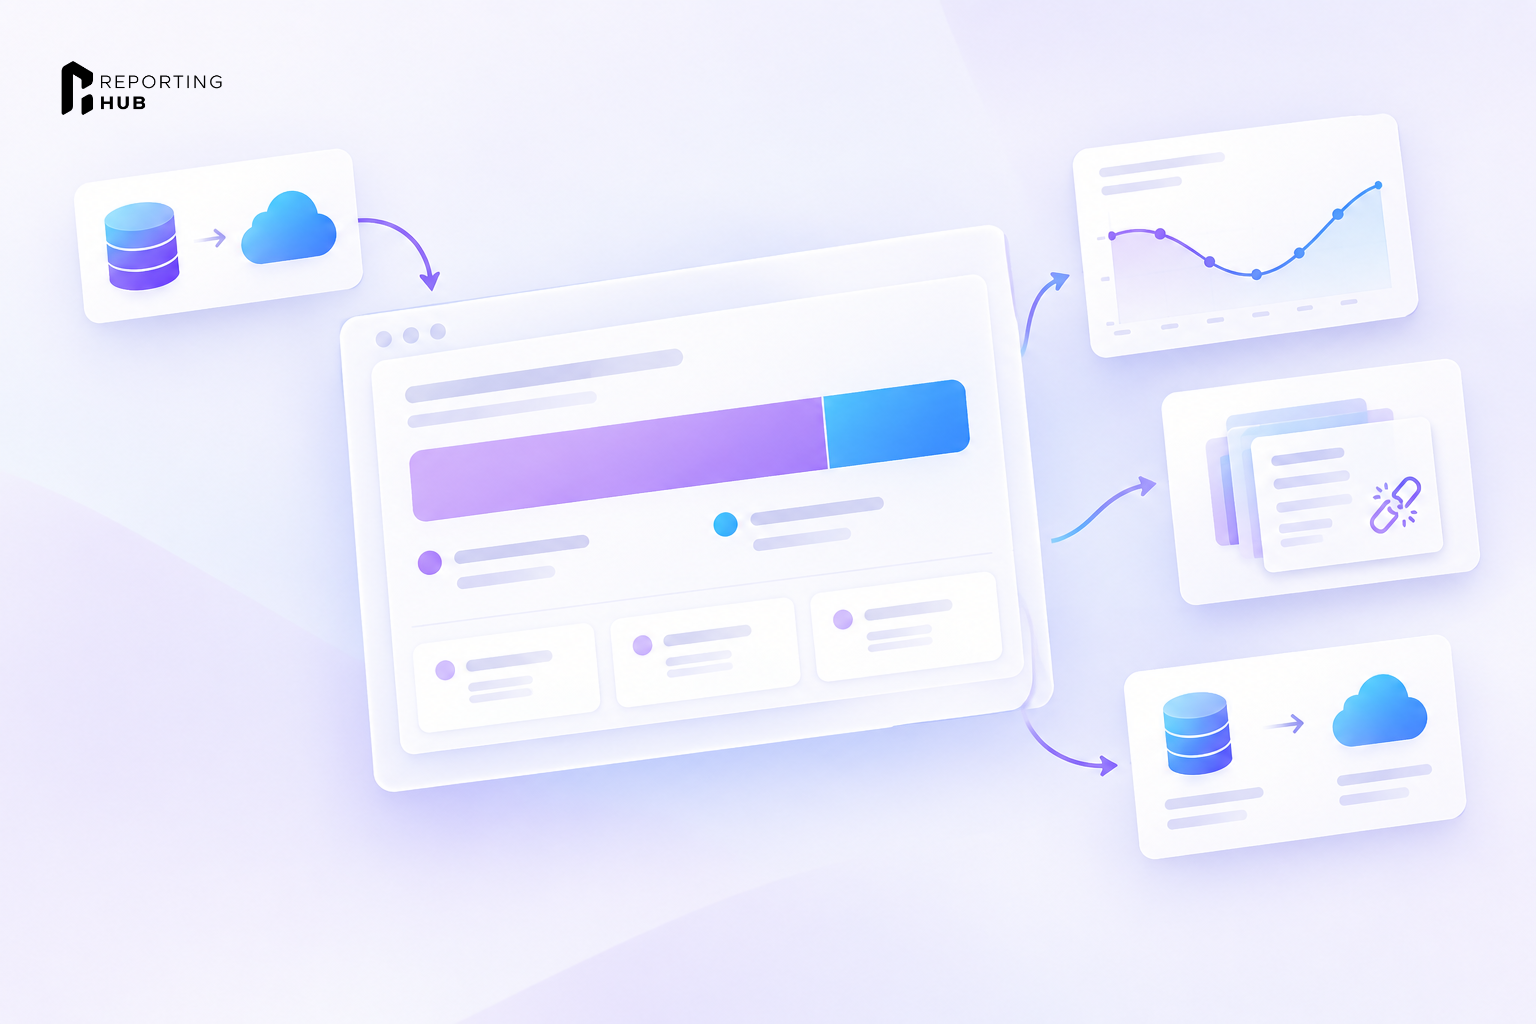
The problem can start with a report author creating a new semantic model for each report. Once those models define a KPI differently, finance has to ask an analyst to reconcile them. Sharing a model can reduce that work, but it makes change review more important. When the model owner changes a measure, connected reports in other workspaces can inherit the change before their owners know about it. The analyst may then have to trace the change and check which reports need a fix.
What governed, managed BI changes
In Microsoft’s managed self-service BI setup, a central team usually maintains a small set of shared semantic models. Department teams build their own reports on those models and can decide how to present the figures. Finance can agree on a KPI once, and report authors can reuse the approved measure.
Certification depends on the standards behind the label. A team can start with the five KPIs finance reviews most often and name an owner for each model. Power BI administrators set up certification and choose who can grant it.
A shared model has to contain the data that a report needs if the author uses a live connection. A company may therefore need several shared models for different business areas. A high ratio of reports to models can show reuse, while the certification review checks that the underlying measures are sound.
Forrester’s 2022 study, commissioned by Microsoft, modeled savings from centralized reporting and better self-service. Based on interviews with five organizations, it estimated four hours saved per analyst per week in Year 1 and six hours in Year 3. The modeled company had 40,000 employees and $10 billion in revenue. A mid-market team can use its own time logs to see how much of that type of work it could cut.
Where Reporting Hub fits
Reporting Hub provides a branded Power BI portal that runs in your Azure environment. It applies row-level security based on the signed-in user and logs changes to content access and RLS roles. Your Azure service costs are billed separately to your Azure subscription. The BI team still owns the Power BI models and their KPI definitions.
A practical way to recover analyst hours
Frequently asked questions
How much time do data analysts spend on data preparation?
Anaconda’s 2020 survey put the average at 45% across its respondents. In Xplenty’s 2015 survey, a third of BI professionals said they spent 50–90% of their time cleaning raw data. A two-week time log gives you a starting point for your own budget.
How do I calculate the cost of low analyst productivity?
Multiply each analyst’s labor cost by the share of time they spend on work the team could avoid. If you use a fully loaded labor rate, it already includes benefits. Track decision delays separately so they stay visible alongside the cost of staff time.
Does governance eliminate data preparation?
Analysts still have to prepare new data and check its quality. Shared models can reduce the number of times different teams do that work for the same reports. A clear change process can also cut repair work after an update.
What is managed self-service BI?
A central team usually owns the shared Power BI models and their measures. Departments build the reports they need using those models. Report authors can request Build permission when they need access to an existing model.
Does Reporting Hub replace a BI governance program?
Reporting Hub delivers Power BI content from your Azure environment. Its logs help administrators review changes to portal access and RLS roles. Your BI team remains responsible for model ownership and the review process for shared measures.
References
- Anaconda. 2020 State of Data Science Survey. anaconda.com
- U.S. Bureau of Labor Statistics. Occupational Employment and Wages: Data Scientists. bls.gov, May 2025.
- Microsoft Learn. Managed Self-Service BI in Power BI. learn.microsoft.com, 2025. Microsoft Learn. Impact Analysis for Semantic Models. learn.microsoft.com, 2025.
- Microsoft Learn. Endorsement: Promote and Certify Content. learn.microsoft.com, 2025.
- Forrester Consulting / Microsoft. The Total Economic Impact™ of Microsoft Power Platform. microsoft.com, 2022.