
1. Understand the Audience’s Needs
Before jumping into the dashboard creation process, it’s essential to understand your target audience. Non-technical audiences are typically more interested in high-level insights rather than granular data points. Identify the key metrics that matter to them—for example, sales pipeline, customer satisfaction, or operational efficiency.
The goal is to minimize complexity while providing actionable insights. Focus on core metrics to avoid overwhelming your audience with unnecessary data and keep their attention on what’s most important to them.
2. Start with a Clear Layout
The design and layout of your dashboard should be simple and intuitive.


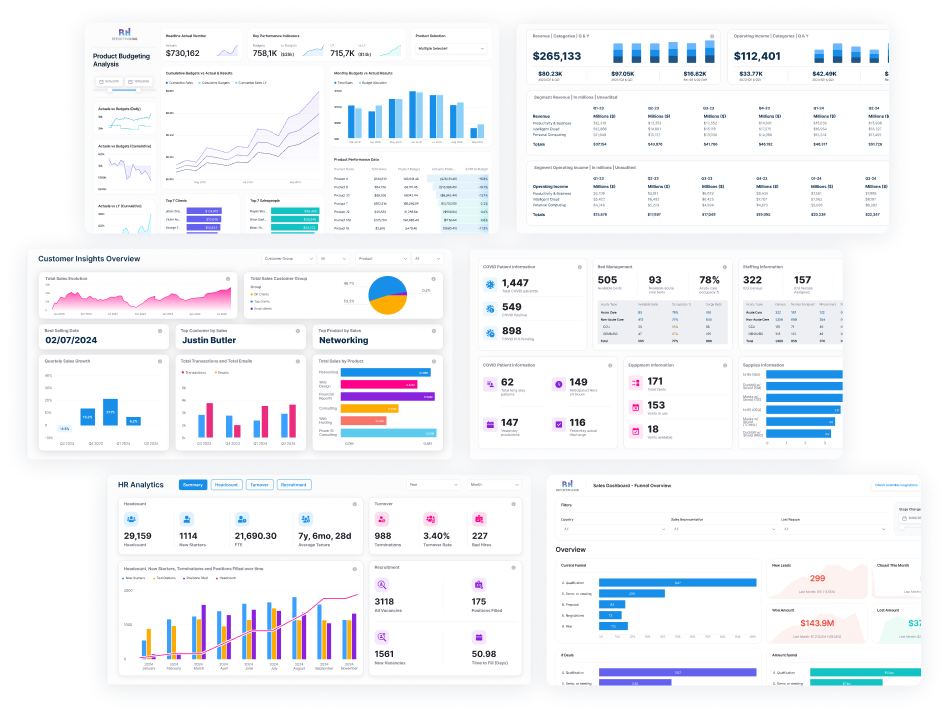
3. Choose the Right Visualizations
Non-technical viewers often find it easier to understand data when it’s presented in simple visual formats.
Power BI offers a wide range of visualization options, but the key is to pick the right ones:


4. Incorporate Filters and Slicers
One of Power BI’s most powerful features is the ability to interact with data using slicers and filters, which allow viewers to manipulate the dashboard and focus on specific data points. The platform offers several types of filters.
Here’s how to make them work for a non-technical audience:
5. Leverage Automated Data Alerts and Subscriptions
Help your non-technical audience stay up-to-date on analytics reporting by automating insights. Power BI allows users to set up data alerts and email subscriptions so they don’t have to constantly check the Power BI dashboards. These features ensure that viewers receive notifications whenever data crosses a predefined threshold or if new reports are published. This way, non-technical audiences can stay informed and react to changes quickly without having to actively check the dashboard.

Automated alerts and subscriptions can also be tailored to specific user roles or groups, so that only relevant information is shared with each individual.
6. Provide Easy-to-Understand Explanations
To make dashboards truly user-friendly, provide easy-to-understand descriptions or titles for each visualization. Avoid jargon and technical language; instead, describe the visuals in everyday terms that resonate with your audience. For example:
Use captions or descriptions when necessary to clarify what the visualizations represent and why they are important.
These simple changes can make a big difference in helping non-technical audiences understand the data and its implications.
7. Ensure Mobile Accessibility
Many non-technical viewers will access dashboards via their smartphones or tablets, given the pace of work today. Power BI offers built-in mobile optimization, ensuring dashboards are responsive and readable on smaller screens.
Keep mobile accessibility in mind during the design process. Ensuring that key metrics and filters are easy to access on mobile devices. Consider creating separate mobile-specific dashboards, with fewer visualizations and a simplified layout for ease of use.

8. Test for Simplicity
Once the dashboard is created, it’s important to test it with your target audience. Ask a few non-technical colleagues to explore the dashboard and provide feedback on its usability.
Ensure that all interactions (such as filters, slicers, and drill throughs) work smoothly and that the key takeaways are clear without requiring additional explanation.
Consider the feedback that you get from your colleagues and simplify the design as needed to make it easy for non-technical audiences to navigate and understand.
Conclusion: Empower Non-Technical Audiences with Power BI
By focusing on simplicity, usability, and accessibility, you can create dynamic Power BI dashboards that empower non-technical audiences to make data-driven decisions. The key is to remove the technical complexity while maintaining the ability to dive deep into the data when needed. When done right, Power BI dashboards can become an invaluable tool for everyone in the organization, regardless of their technical expertise.
With the right approach, you can use Power BI to bridge the gap between data and actionable insights for all users, and help to foster a culture of informed decision-making across your team.