Power BI Healthcare Analytics Dashboard - All Data In One Governed View

A Power BI healthcare analytics dashboard is an analytics environment that brings together data from EHR, billing, and scheduling systems into one governed, real-time view. Clinical, operational, and finance teams get the visibility they need to make decisions without waiting for reports.

Healthcare organisations relying on fragmented systems often wait 48 hours or more for data that is already outdated. A healthcare BI dashboard connects that data in real time and makes it accessible to the right people, at the right level of detail.

Smiling man with short dark hair wearing a dark shirt against a blue gradient background.
Brian DeLuca
12 min read . July 2025
Power BI Healthcare Analytics dashboard
FROM FRAGMENTED SYSTEMS TO ONE CONNECTED VIEW

Healthcare teams don't lack data. They lack connection between it

Icon
Patient Flow and Capacity
See admissions, discharges, bed occupancy, and wait times in real time. Spot bottlenecks as they form and act before they affect care delivery.
Icon
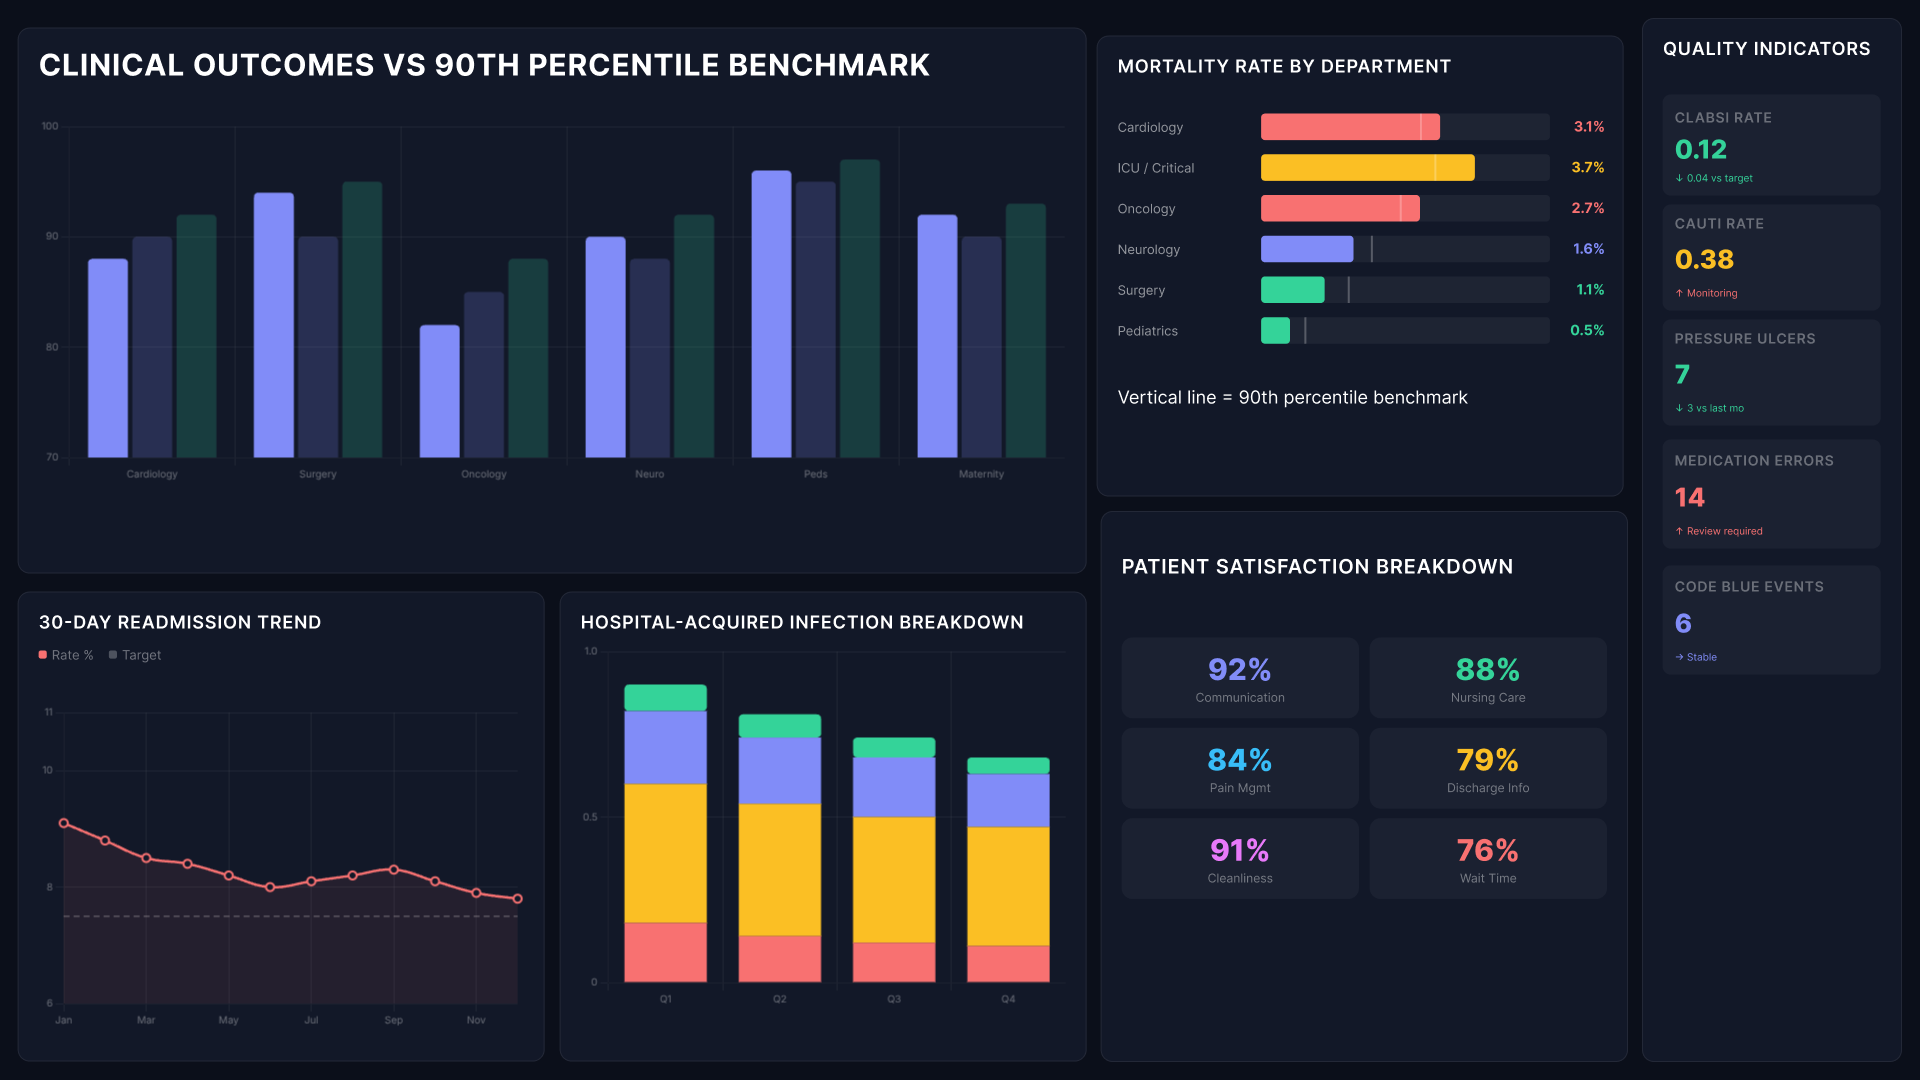
Clinical Outcomes
Track readmission rates, infection rates, and department-level outcomes against benchmark. Quality improvement conversations become grounded in evidence, not anecdote.
Icon
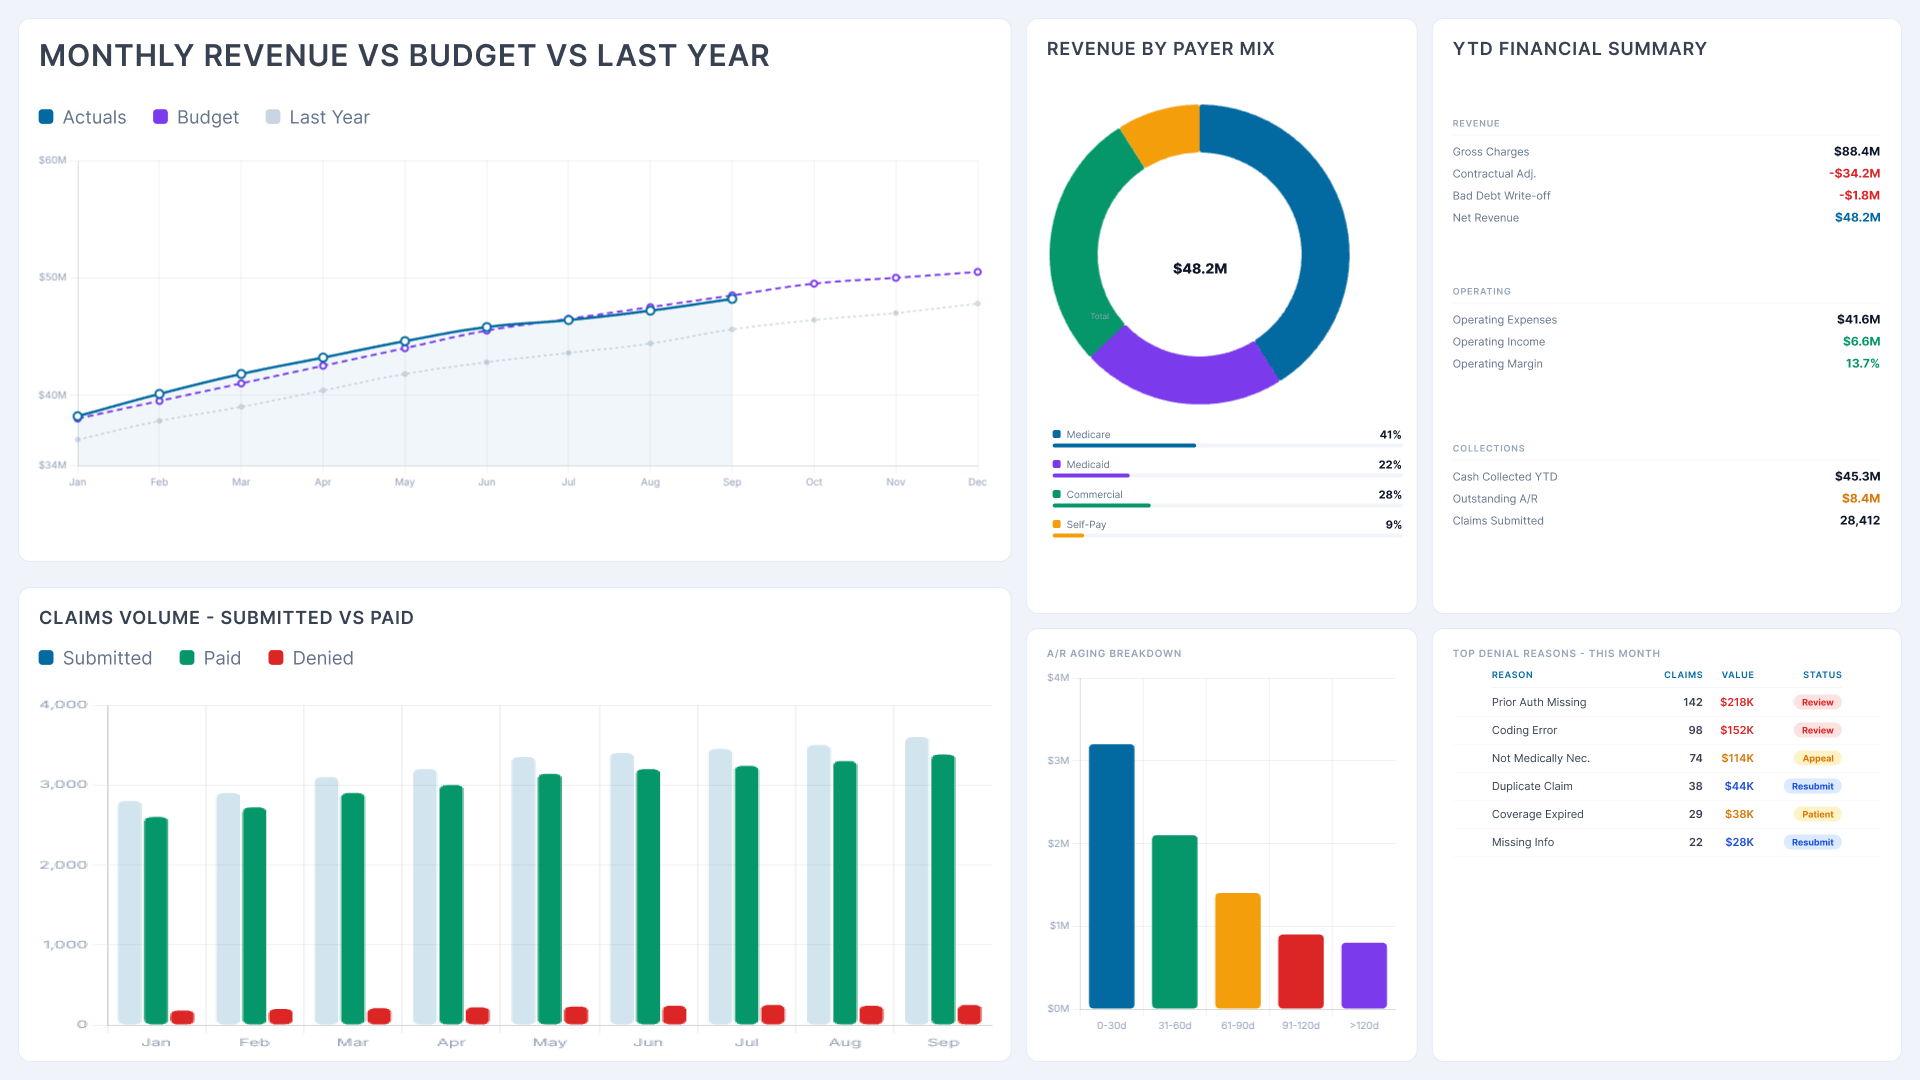
Revenue and Financial Performance
Connect clinical activity to billing outcomes across departments, treatment types, and payer categories. Identify where revenue is leaking. Understand where costs are running ahead of activity.
Icon
Length of Stay and Throughput
Monitor how long patients stay and how quickly they move through the system. Surface the patterns that extend stays beyond target. Forecast bed demand from historical trends rather than assumptions.
Icon
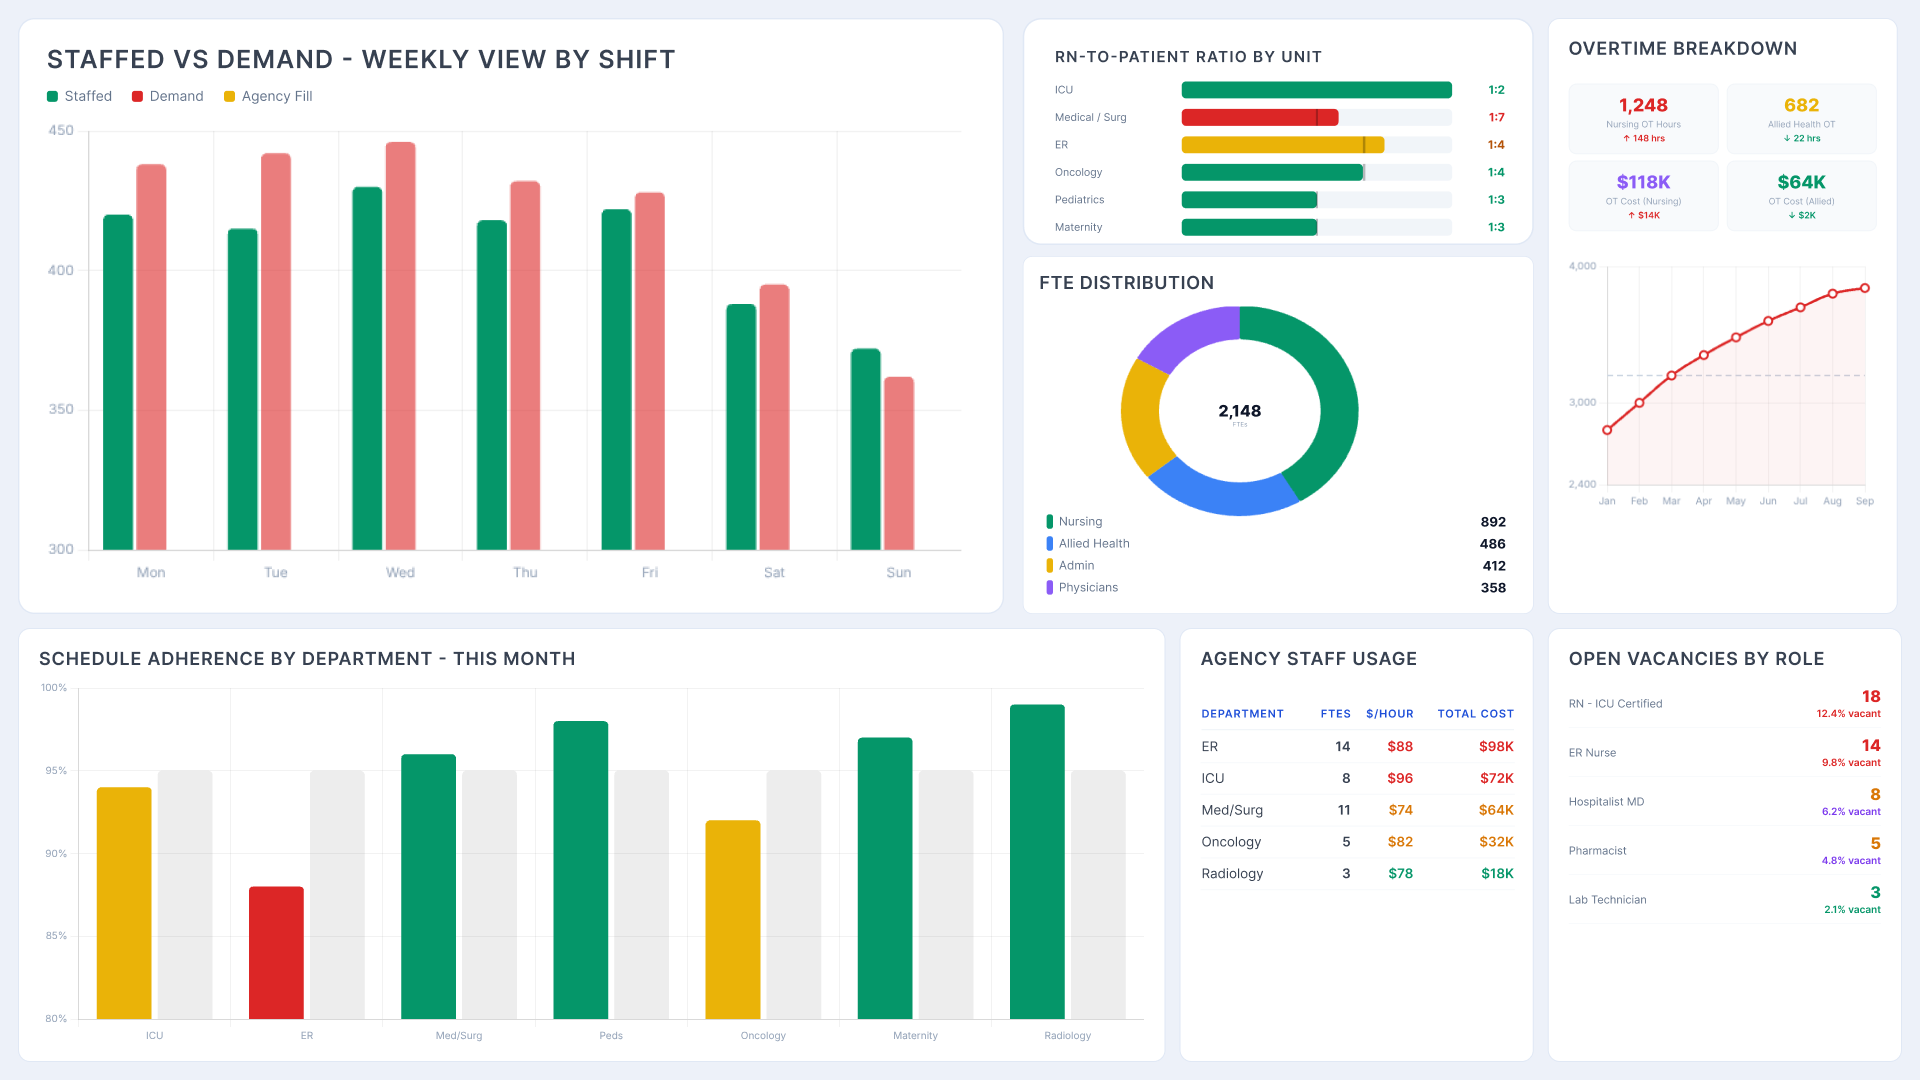
Workforce and Staffing Alignment
Compare staffing levels against actual patient demand by department and shift. See where overtime concentrates. See where capacity is misaligned with volume before it affects care delivery.
Icon
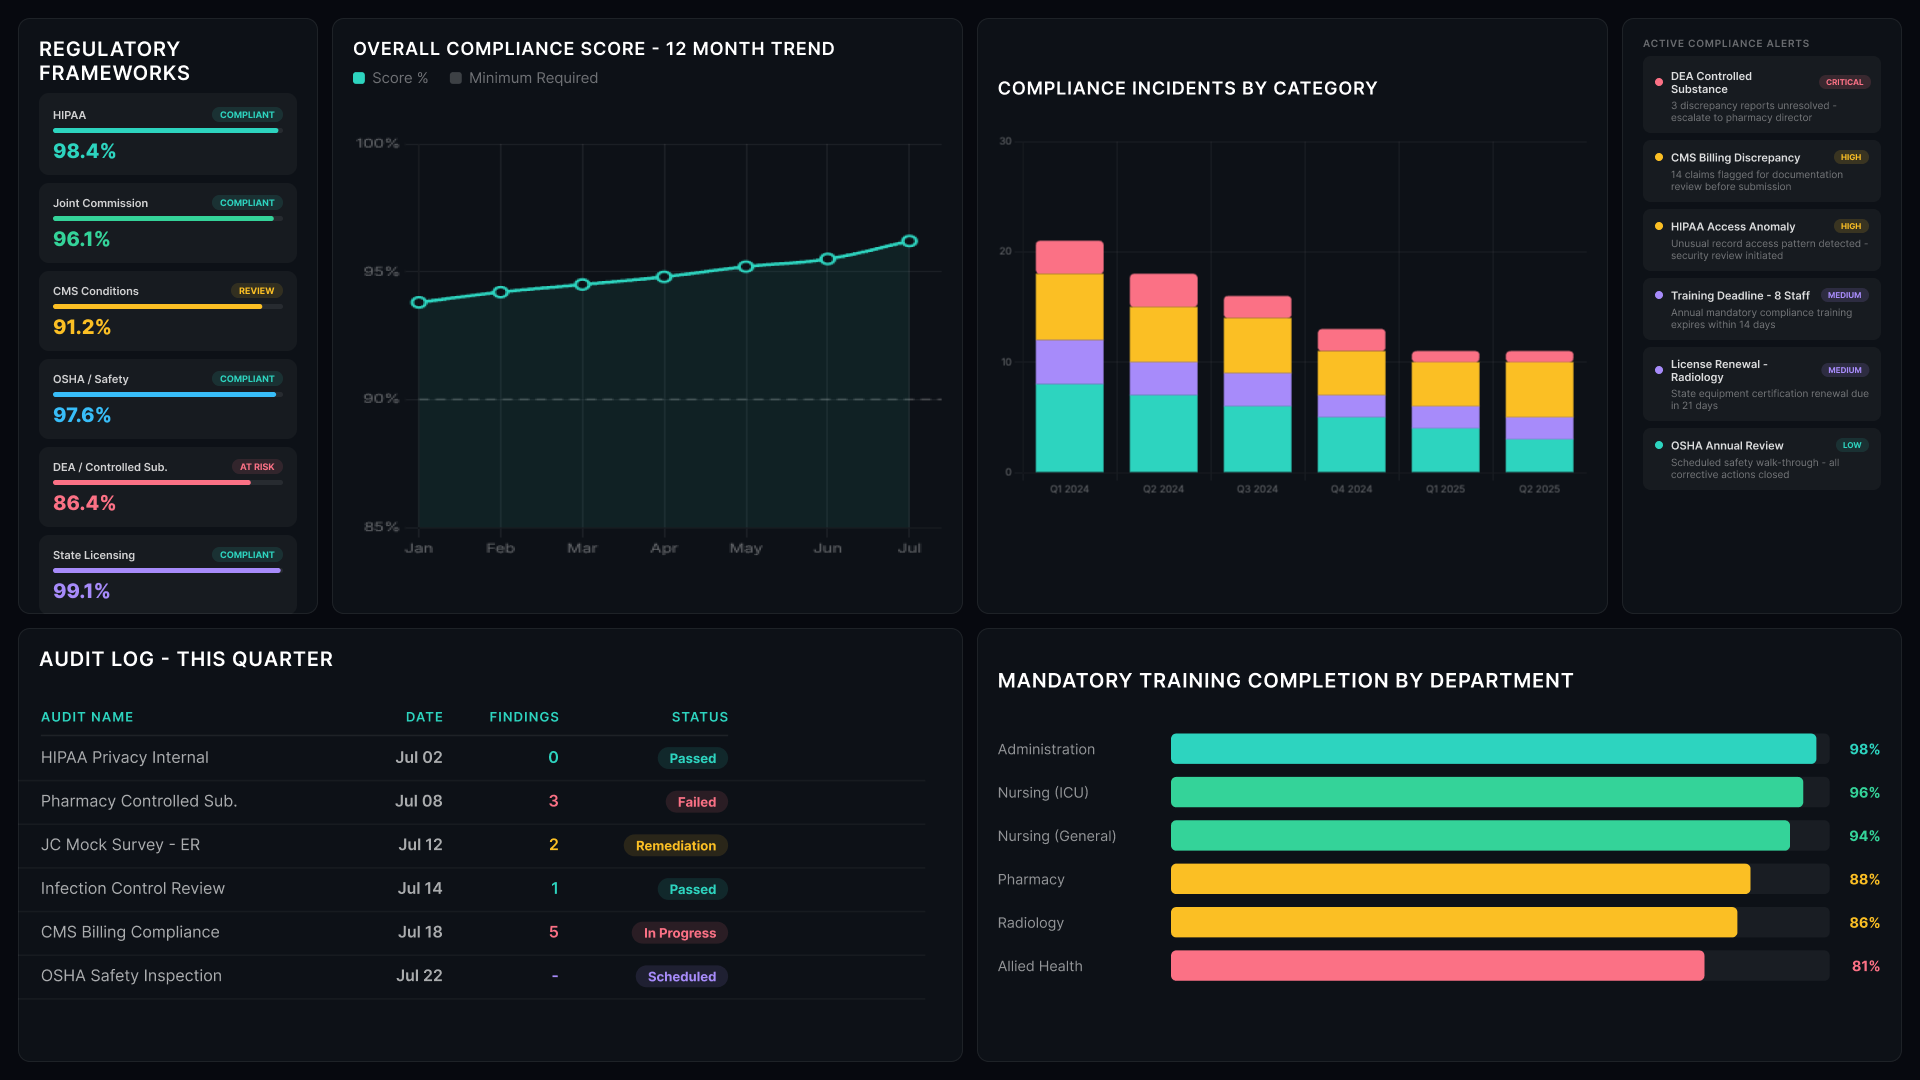
Compliance and Regulatory Metrics
Track the KPIs your regulatory obligations require. Automate compliance metric extraction so reporting cycles stop consuming manual effort. Maintain a governed audit trail that is always current, not reconstructed under pressure.

What Power BI Healthcare Dashboard Makes Visible

Clinical, operational, and financial data in one continuous view - built on your existing Power BI environment.

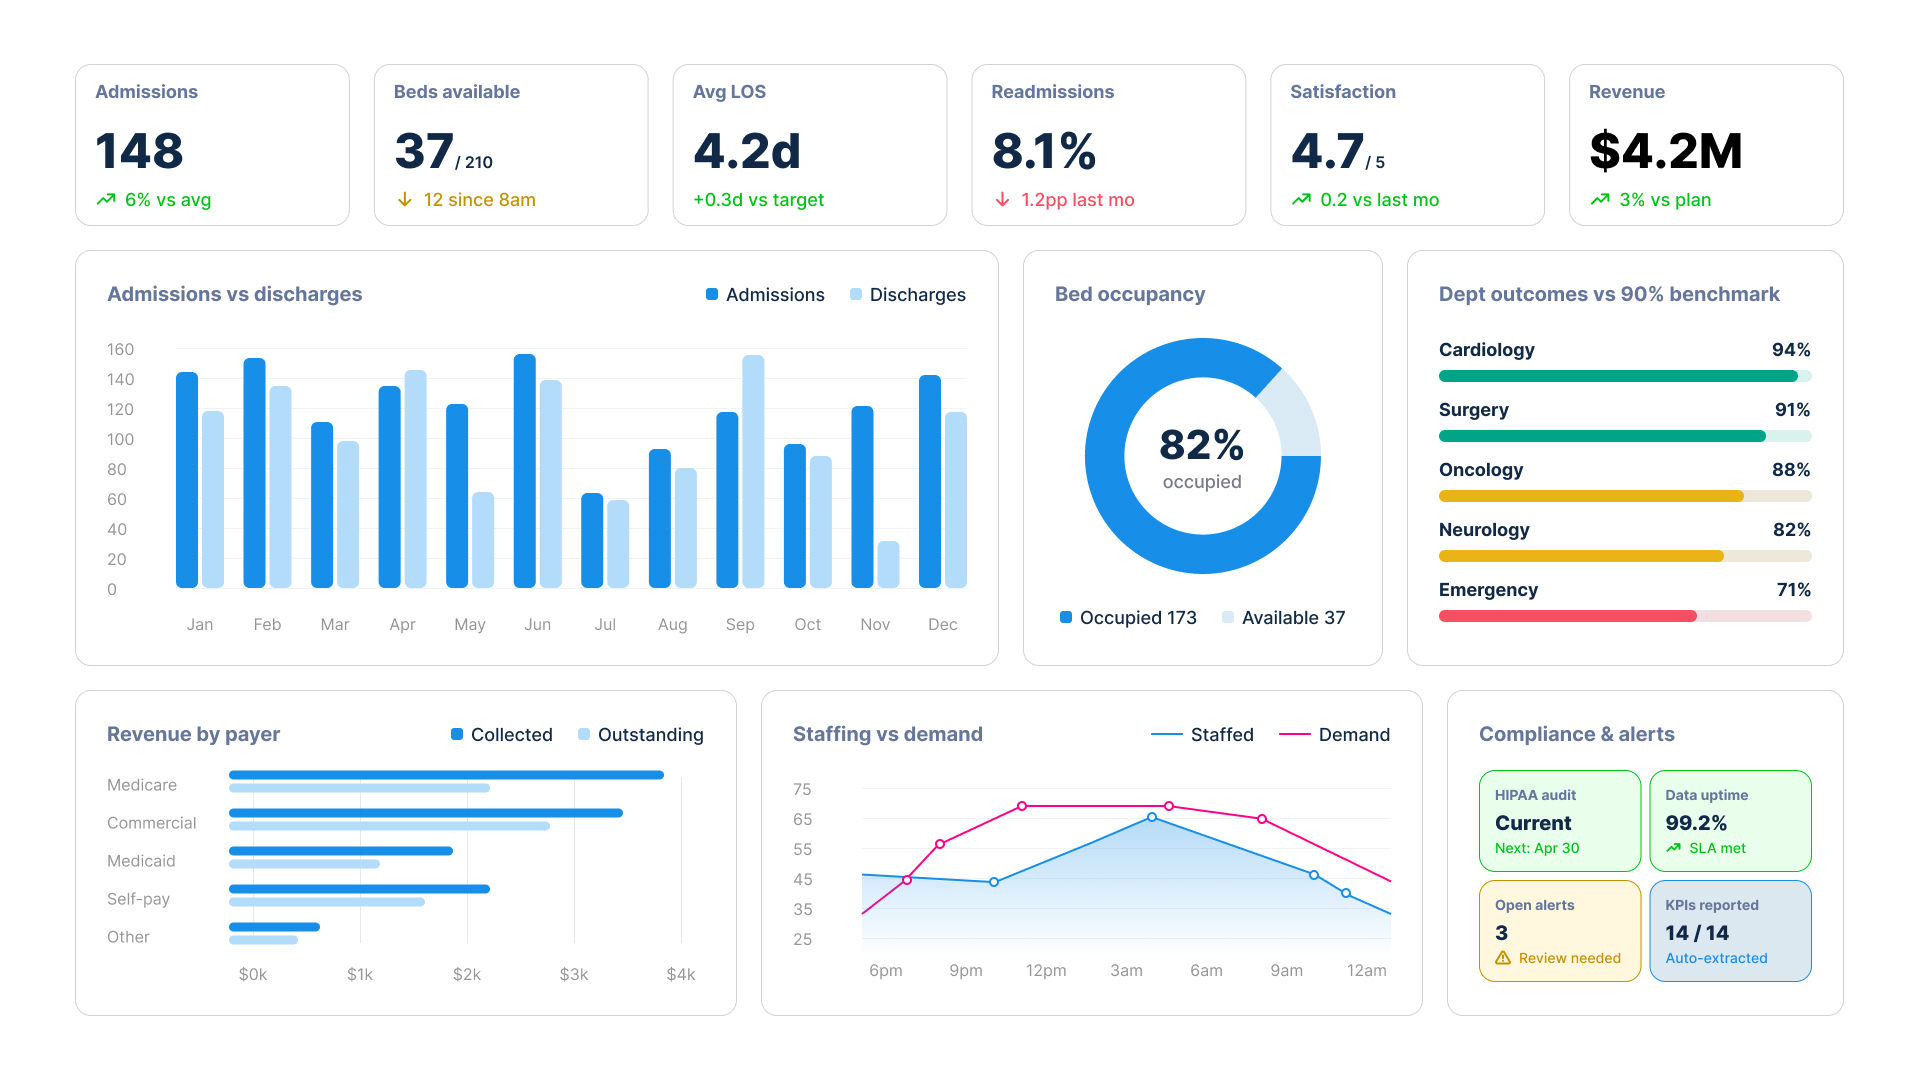
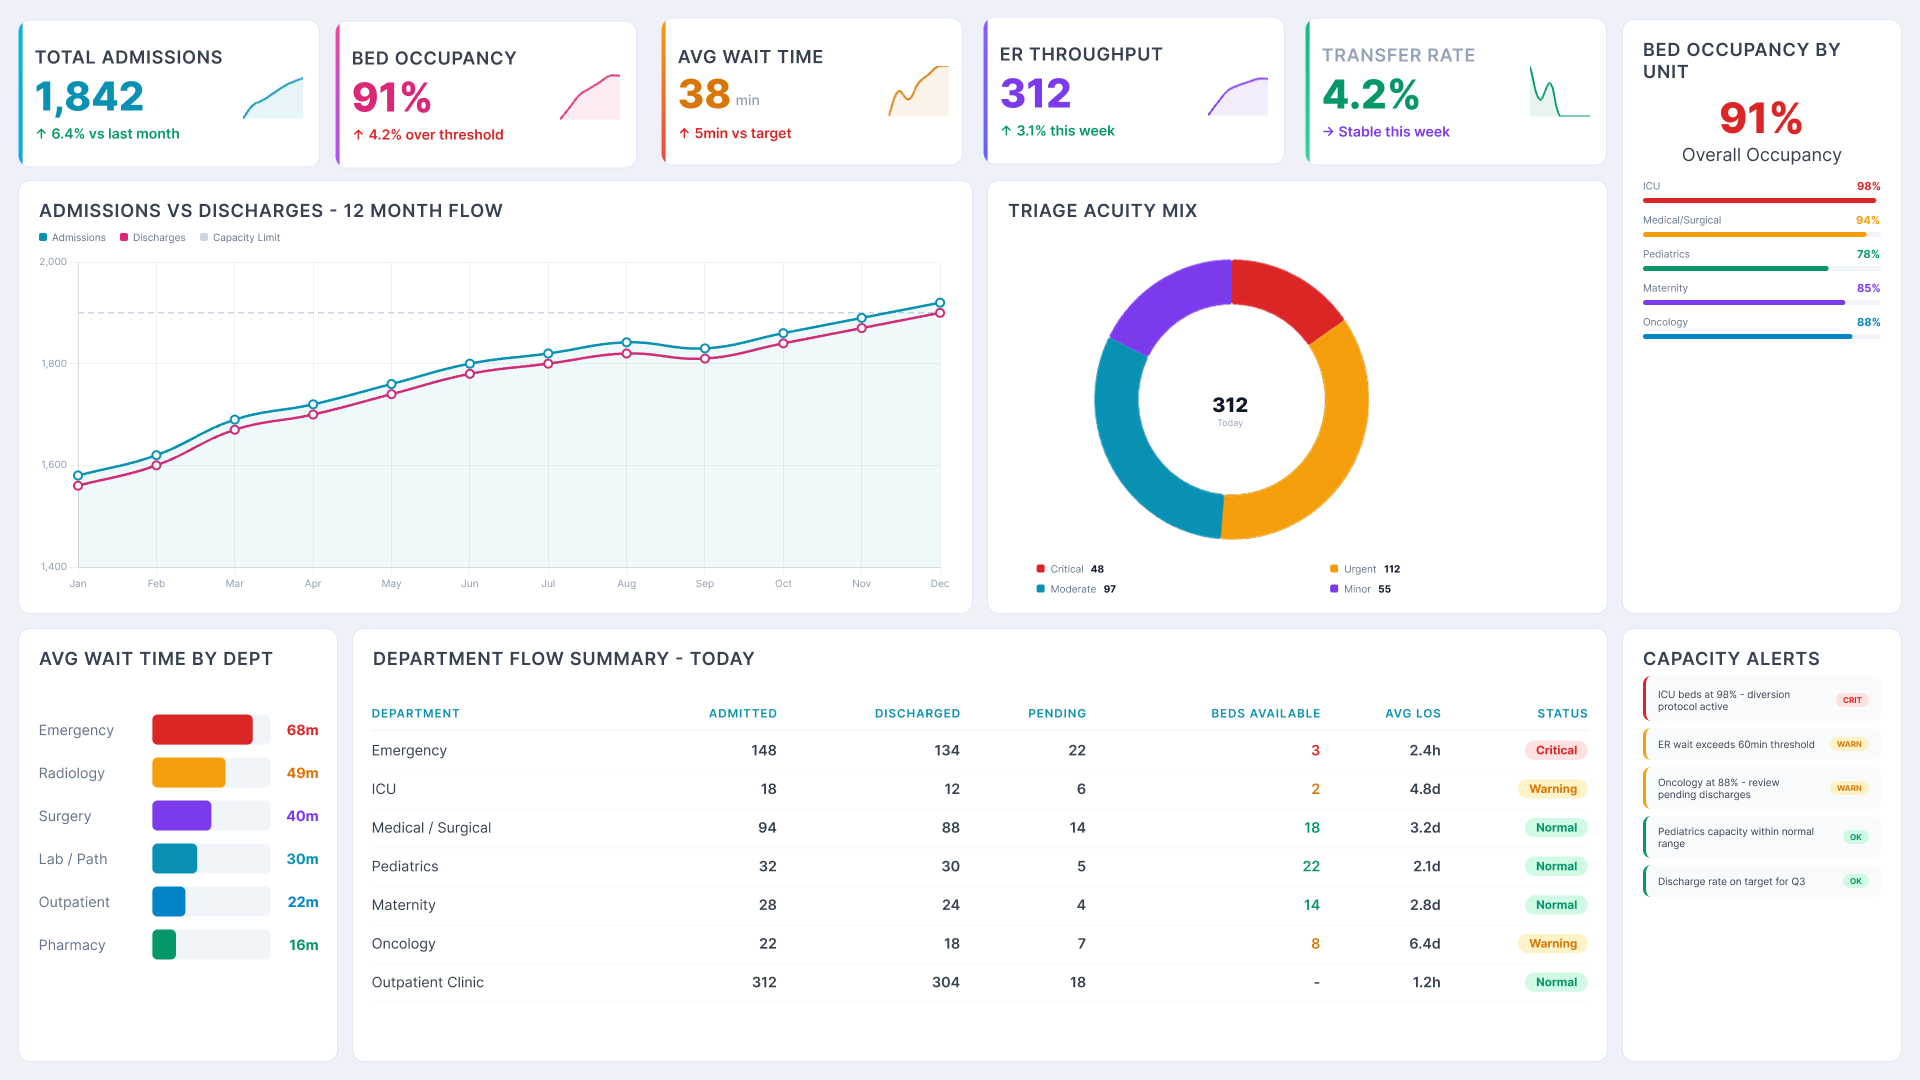
Patient Flow and Capacity Dashboard
Power BI Healthcare Analytics dashboard
See admissions, discharges, bed occupancy, and wait times in real time across every department. Spot bottlenecks as they form and act before they affect care delivery or breach capacity thresholds.
Operations managers get real-time visibility into patient flow and discharge patterns - intervention happens while the outcome can still change.
Abstract background with a diagonal split between light blue and dark navy blue colors.

Clinical Outcomes Dashboard

Power BI Healthcare Analytics dashboard
Track readmission rates, infection rates, mortality rates, and department-level outcomes against the 90th percentile benchmark. Patient satisfaction scores visible alongside clinical quality indicators.
Clinical directors see outcome variation across departments and care pathways - quality improvement conversations become grounded in evidence, not anecdote.
Background Image of dark-section-bg-bottom

Revenue Cycle Dashboard

Power BI Healthcare Analytics dashboard
Connect clinical activity to billing outcomes across departments, treatment types, and payer categories. Identify where revenue is leaking. Understand where costs are running ahead of activity.
Finance leaders can see that a department is over budget - the dashboard connects overspend to the specific clinical activity or length of stay pattern driving it.
Abstract background with a diagonal split between light blue and dark navy blue colors.

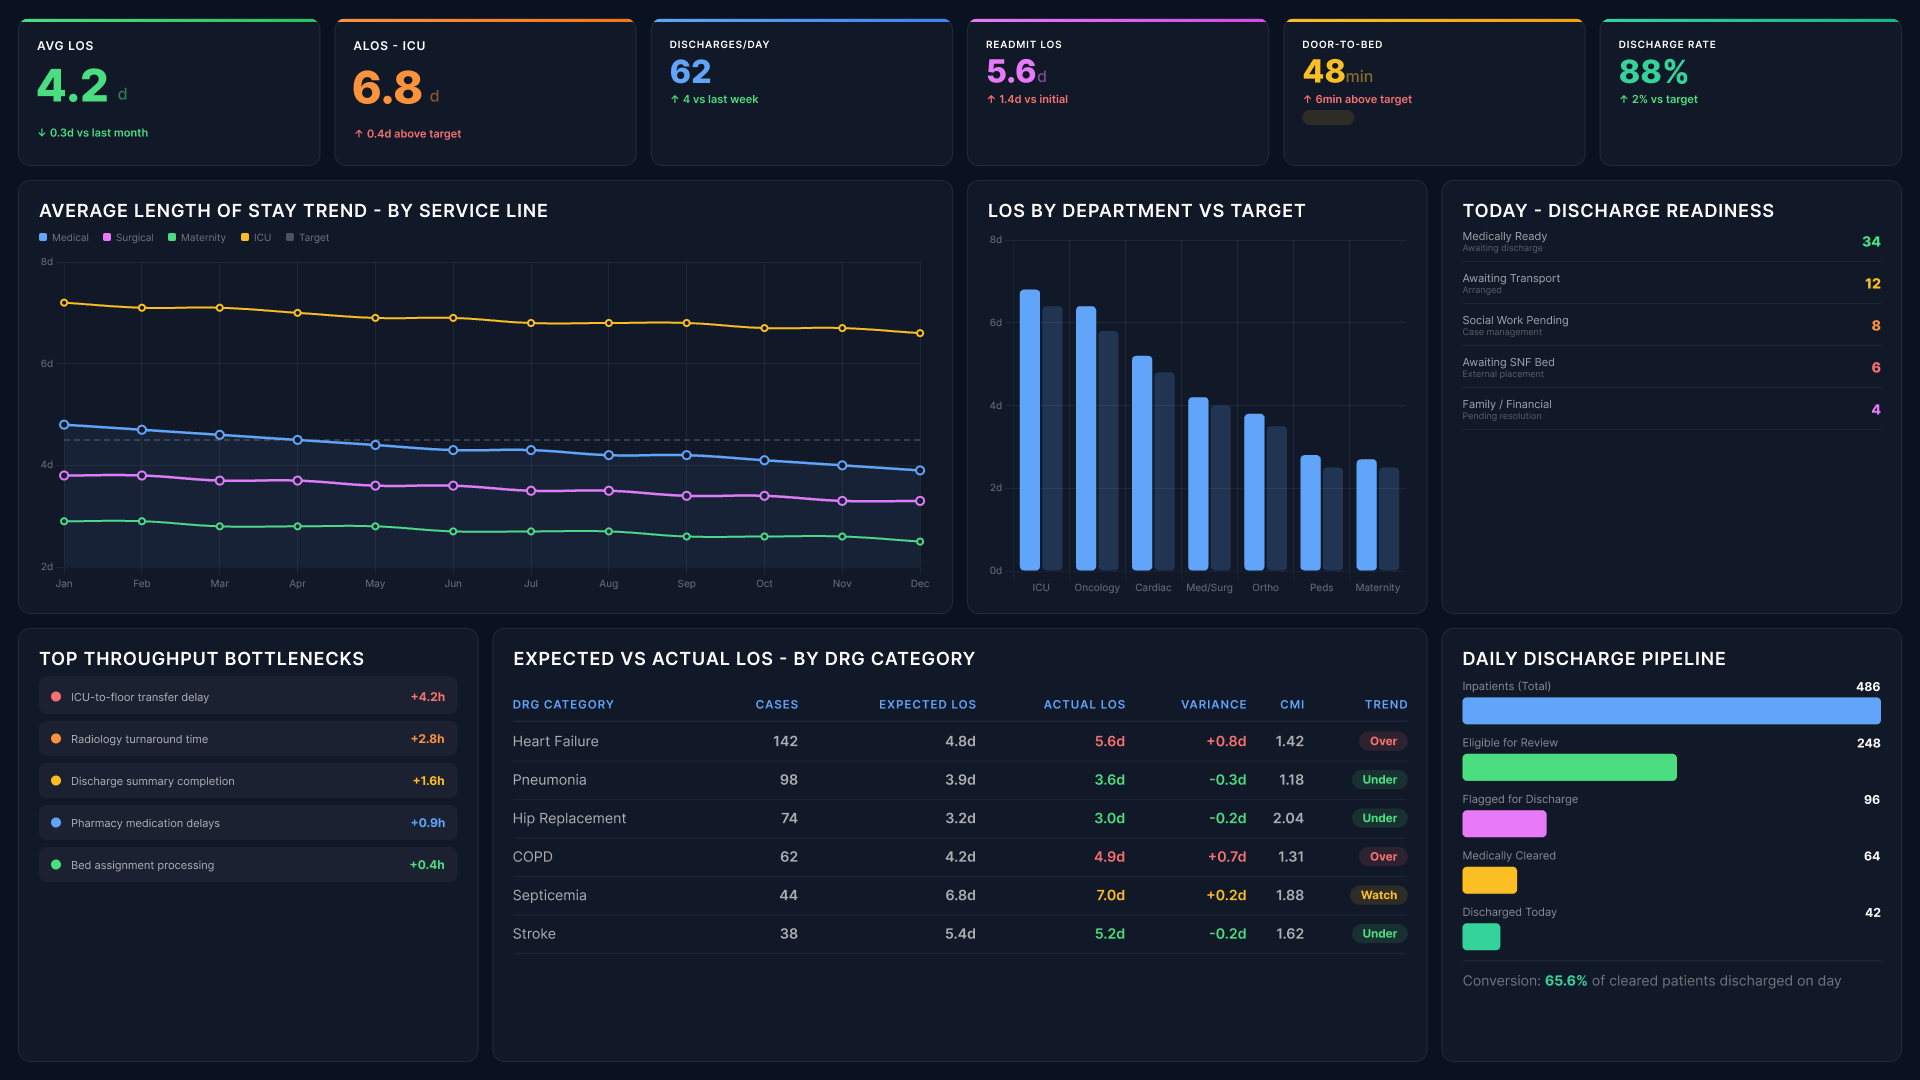
Length of Stay and Throughput Dashboard
Power BI Healthcare Analytics dashboard
Monitor how long patients stay and how quickly they move through the system. Surface the patterns that extend stays beyond target. Forecast bed demand from historical trends rather than assumptions.
See the throughput bottlenecks driving delays - ICU transfer times, radiology turnaround, discharge pipeline - all in one view.
Background Image of dark-section-bg-bottom

Workforce and Staffing Dashboard

Power BI Healthcare Analytics dashboard
Compare staffing levels against actual patient demand by department and shift. See where overtime concentrates. See where capacity is misaligned with volume before it affects care delivery.
Agency fill rates, open vacancies, schedule adherence - all visible before misalignment becomes a care delivery risk.
Abstract background with a diagonal split between light blue and dark navy blue colors.

Compliance and Regulatory Dashboard

Power BI Healthcare Analytics dashboard
Track the KPIs your regulatory obligations require. Automate compliance metric extraction so reporting cycles stop consuming manual effort. Maintain a governed audit trail that is always current, not reconstructed under pressure.
Compliance teams need continuous visibility - the compliance picture is always current, not rebuilt under pressure ahead of an audit.
Background Image of dark-section-bg-bottom
WHAT EACH TEAM GETS FROM A SINGLE CLINICAL AND OPERATIONAL VIEW

How Reporting Hub delivers this without rebuilding your data stack

Icon
Clinical Leadership
Clinical directors see outcome variation across departments, consultants, and care pathways in one place. Quality improvement conversations become grounded in evidence. Not anecdote. Not a spreadsheet someone prepared the night before.
Icon
Operations Teams
Operations managers get real-time visibility into patient flow, bed availability, and discharge patterns. Bottlenecks become visible at their root cause. Intervention happens while the outcome can still change.
Icon
Finance Teams
Finance leaders can see that a department is over budget. What they often cannot see is why. The dashboard connects overspend to the specific clinical activity or length of stay pattern driving it. No bespoke data request needed.
Icon
Compliance and Risk Teams
Compliance teams need continuous visibility into the metrics regulators and commissioners track. The dashboard automates KPI monitoring against regulatory benchmarks. The compliance picture is always current. Not rebuilt under pressure ahead of an audit.
Icon
Executive Leadership
Executives need clinical quality, operational efficiency, and financial performance in one summary. The dashboard delivers that without a report request. Drill-down is available when a number needs context. Useful ahead of board meetings, commissioner reviews, and planning cycles.
Icon
No New Infrastructure. No Data Migration.
Reporting Hub connects your existing clinical and operational data into a governed, scalable environment. It works with the Power BI models your organisation already has. Setup takes days, not months. Get a Free Trial

Power BI Healthcare Analytics Dashboard FAQs

What is a Power BI healthcare analytics dashboard?

A HIPAA-compliant clinical analytics platform connecting clinical, operational, and financial data into one real-time governed view.

Which healthcare systems does it connect to?

EHRs, billing systems, scheduling platforms, and supply chain tools using existing Power BI models.

Is patient data kept secure and HIPAA-compliant?

Yes. Row-level security ensures each user sees only their permitted data.

Can external partners or commissioners access the dashboard securely?

Yes. Each external user gets a permission-scoped view with no access beyond their remit.

Can we customize metrics for different departments or stakeholders?

Yes. Layout, data visibility, and detail level are configured independently per audience.

Can the dashboard alert teams when a clinical metric breaches a threshold?

Yes. Alerts are configurable for readmissions, capacity, length of stay, and compliance metrics.

Does it work across multiple hospital sites or health network locations?

Yes. Data connects across sites with filters scoped to each team's location.

How long does implementation take?

Most organisations access live data within days using their existing Power BI environment.