Power BI HR Analytics Dashboard: Understanding Your Workforce and Reducing Attrition

Your organisation generates employee data constantly - across your HRIS, payroll, performance, and engagement systems. A Power BI HR analytics dashboard brings it all together in one clear, interactive view so your HR team can act on it.

Power BI connects to any HR data source and turns it into live, filterable dashboards that every stakeholder can use - from HR business partners to the executive team.

Smiling man with short dark hair wearing a dark shirt against a blue gradient background.
Brian DeLuca
12 min read . July 2025
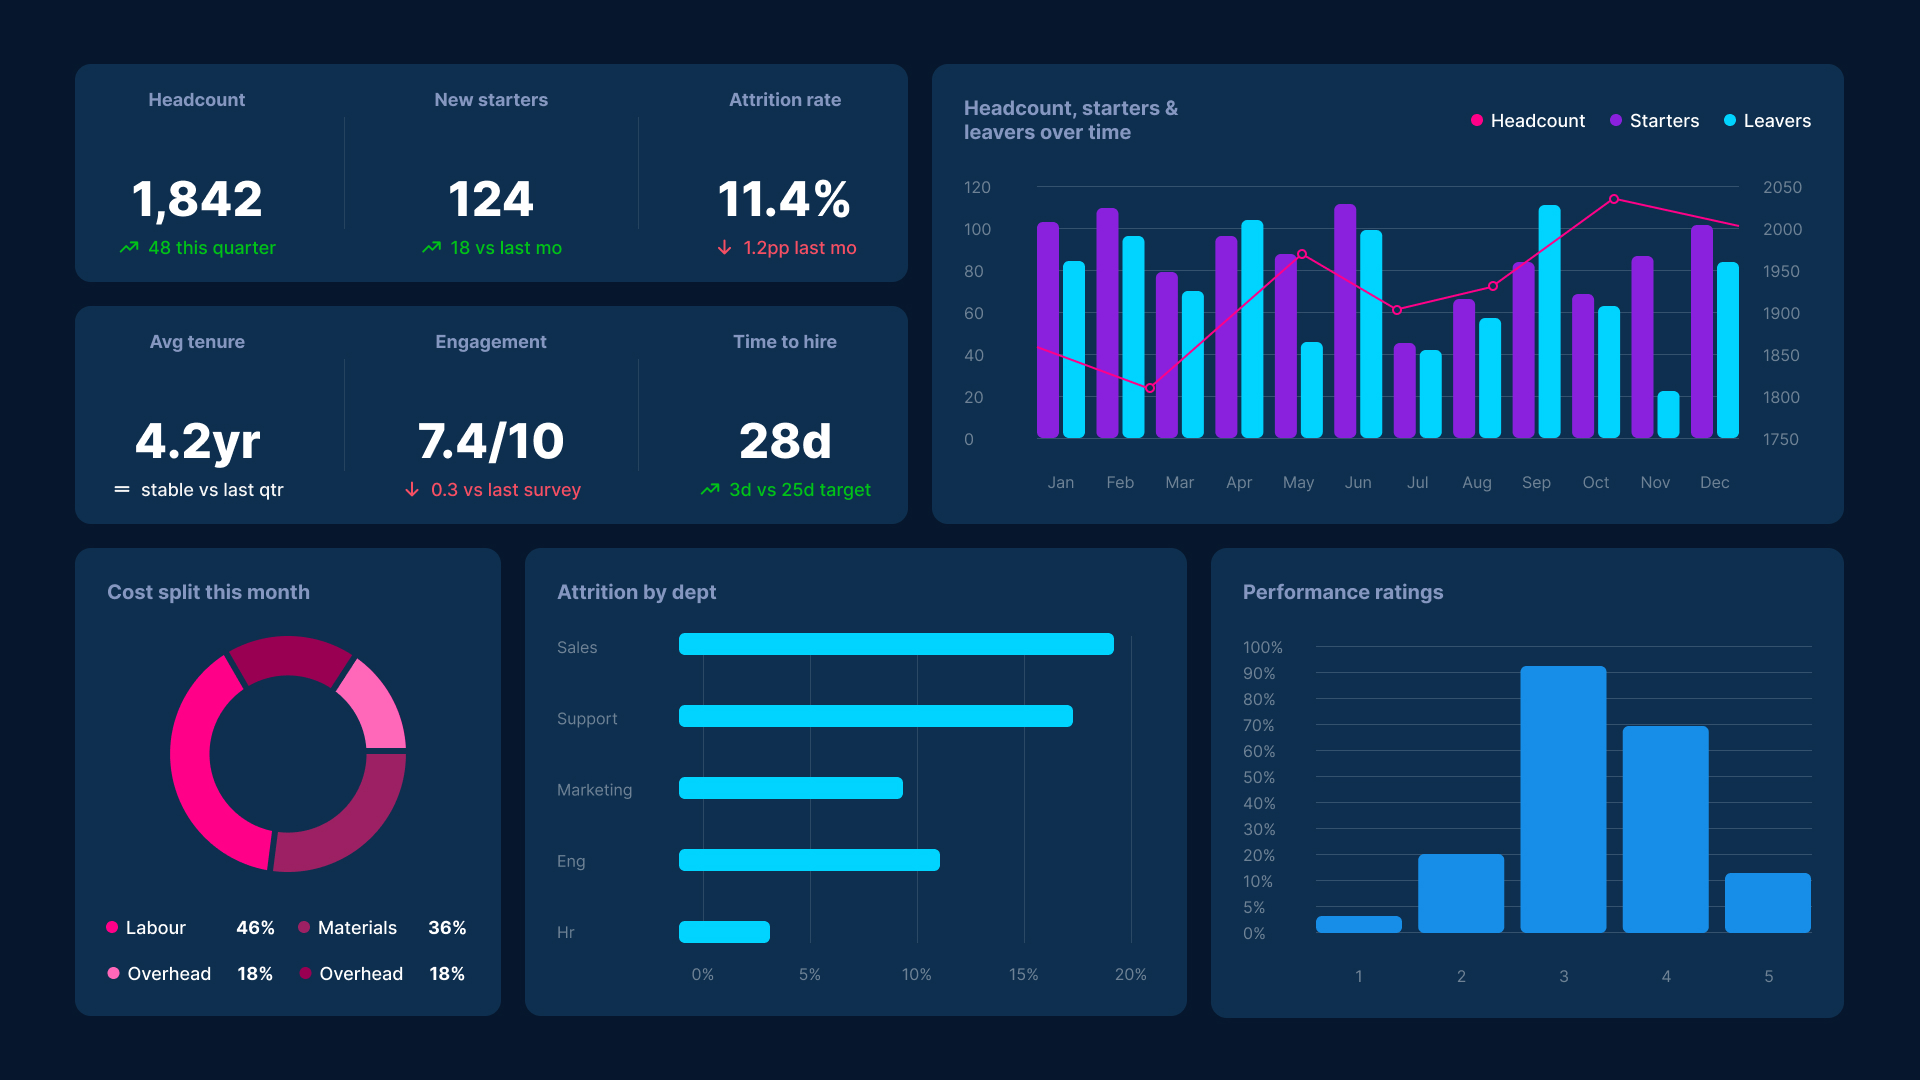
Power BI HR Analytics dashboard
STRUGGLING TO GET A CLEAR PICTURE OF YOUR WORKFORCE?

See how Reporting Hub turns fragmented HR data into workforce intelligence you can act on

Icon
Employee Data Spread Across Multiple Systems
Your HRIS, payroll, performance tool, and engagement platform each hold a piece of the picture. Reporting Hub connects them all into a single, consistent view without requiring migration or restructuring.
Icon
Reports That Are Stale Before They Land
Static exports and manual reports take days to produce and are already out of date when leadership opens them. Live Power BI dashboards give every stakeholder the current view, always.
Icon
No Consistent Definition of Key HR Metrics
Headcount, attrition, and engagement mean different things to different teams. Centralised dashboards establish a single source of truth so every team works from the same numbers.
Icon
Attrition Risk Signals Going Undetected
Early warning signals are buried in data that no one has time to analyse manually. Automated dashboards surface the patterns before they turn into regrettable losses.
Icon
Segmentation Requires Manual Effort
Understanding how different workforce segments perform, engage, and churn requires filtering and cross-tabulation that most teams do not have time to do consistently.
Icon
Limited Visibility for Compliance and Pay Equity
Representation gaps and compensation variances are invisible until they surface in an audit. Real-time DEI and pay equity dashboards let you identify and address risks proactively.

HR Dashboards Built for the Decisions That Matter Most

A connected view of people, performance, and planning - built on your existing Power BI environment.

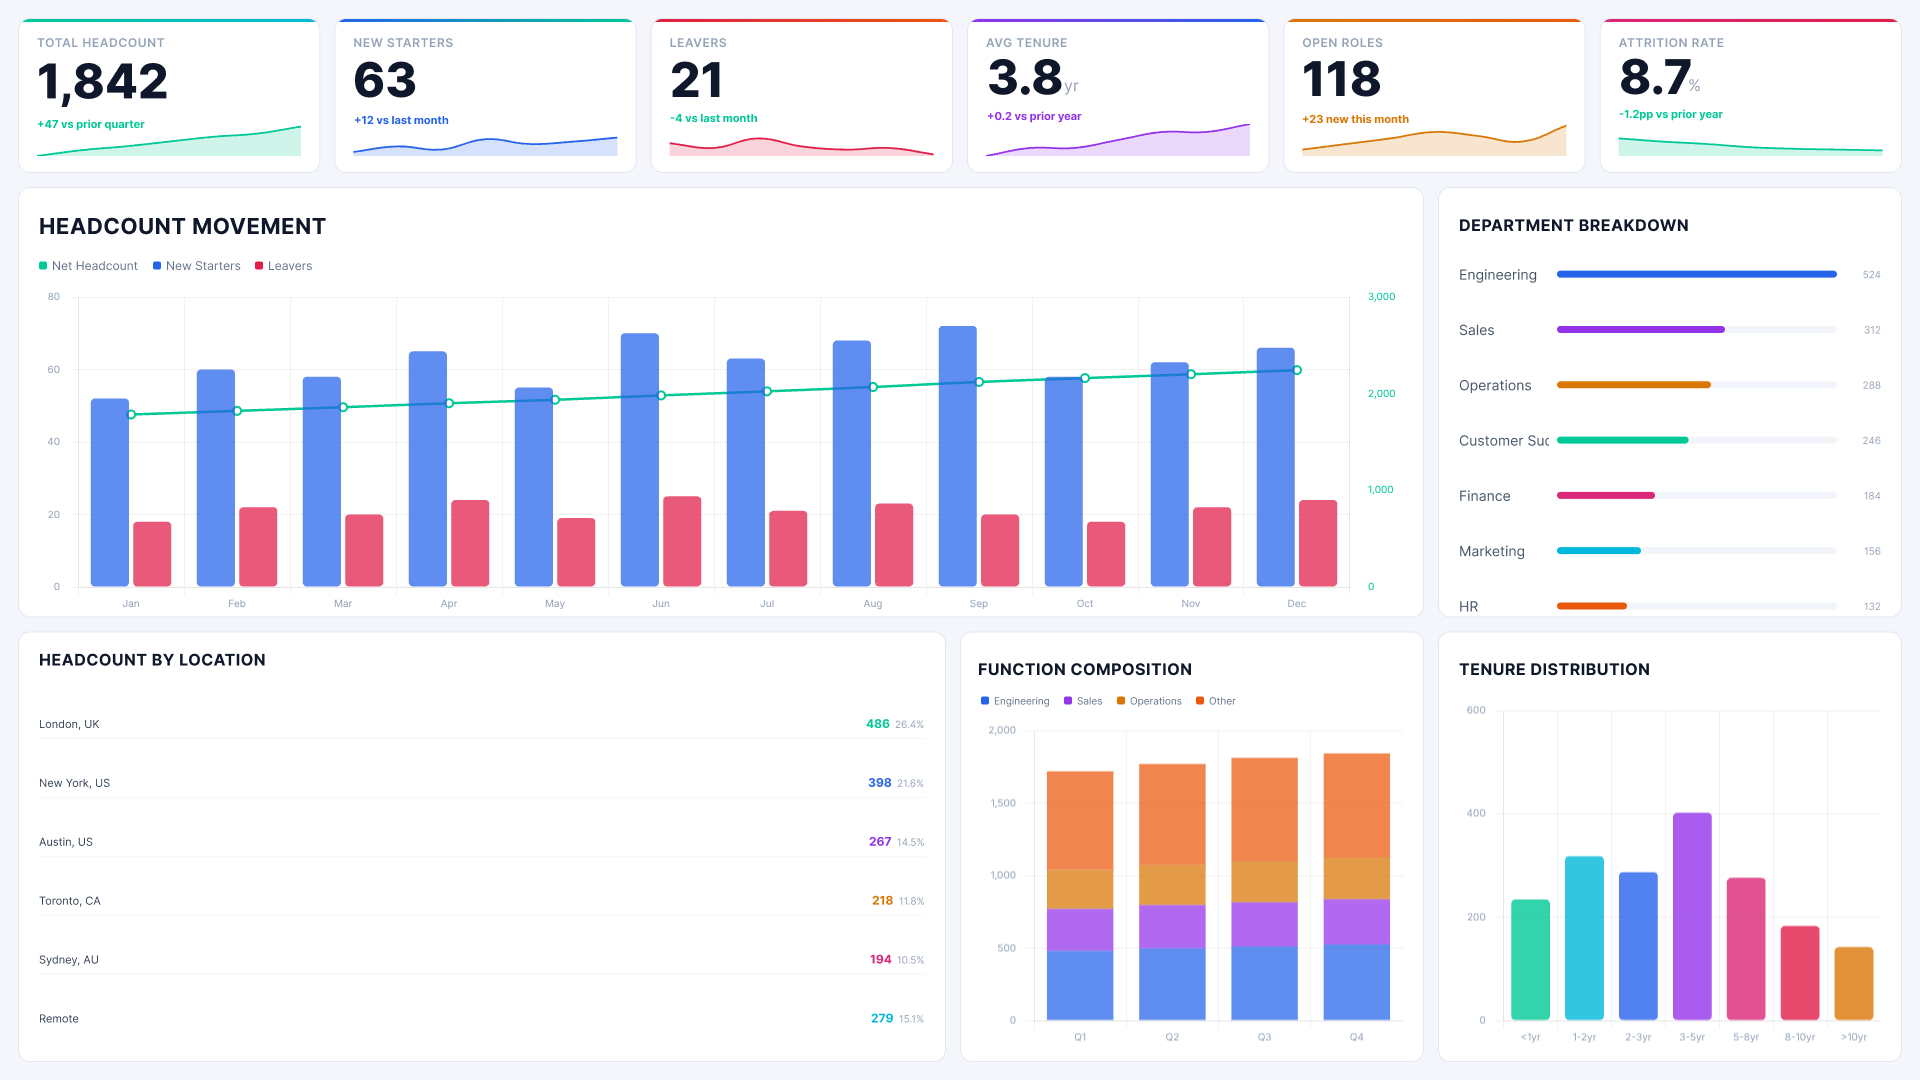
Workforce Overview Dashboard
Power BI HR Analytics dashboard
Track total headcount, new starters, leavers, average tenure, open roles, and attrition rate in real time. See headcount movement by department and location so workforce decisions are grounded in what is actually happening across the organisation.
This gives HR and leadership a single live view of workforce health - without waiting for a report to be rebuilt by hand.
Abstract background with a diagonal split between light blue and dark navy blue colors.

Attrition and Retention Dashboard

Power BI HR Analytics dashboard
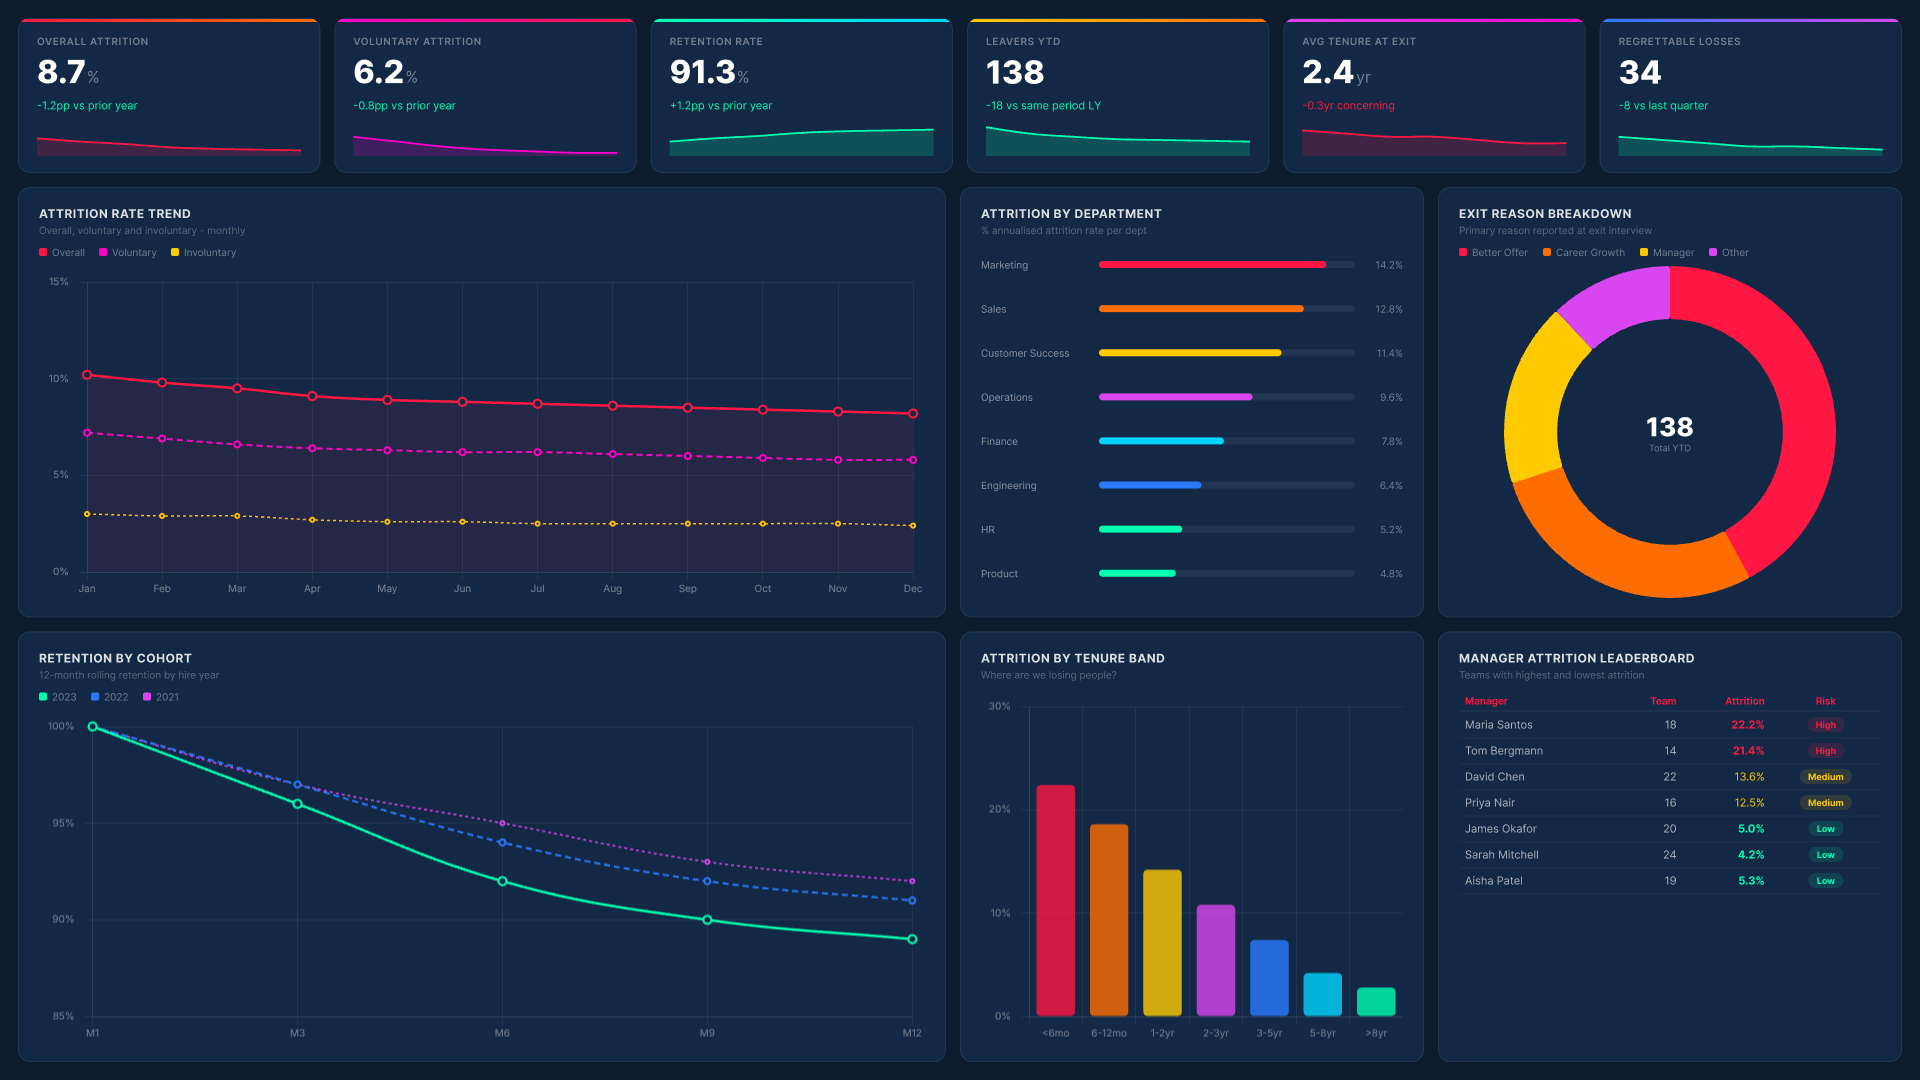
Monitor overall, voluntary, and involuntary attrition trends by department, tenure band, and manager. Exit reason breakdowns and retention-by-cohort analysis give HR business partners the signals they need to act before employees decide to leave.
Proactive retention starts with having the right signals in front of the right people - before an employee makes a decision to leave.
Background Image of dark-section-bg-bottom

Employee Engagement Dashboard

Power BI HR Analytics dashboard
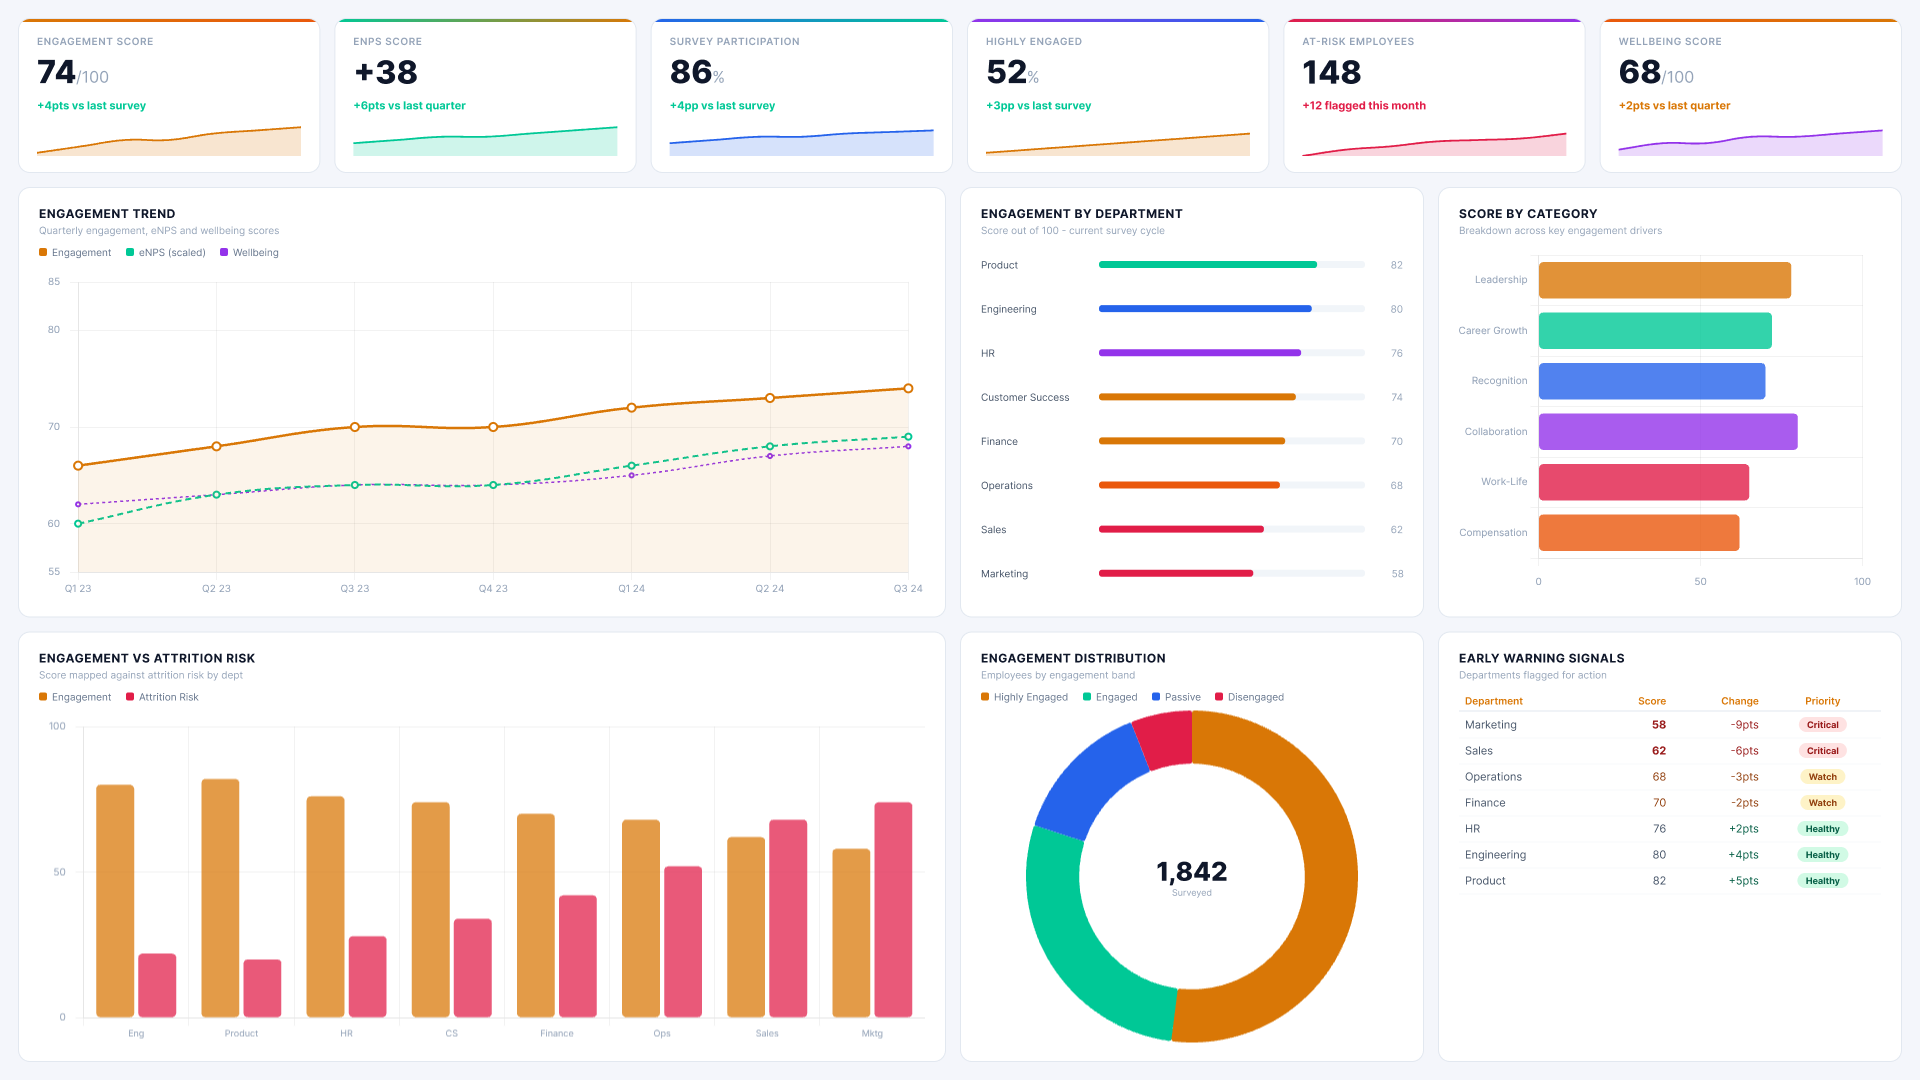
Connect engagement survey data to performance, tenure, and team structure. Track engagement scores, eNPS, wellbeing, and at-risk employee counts by department.
See which conditions correlate with your highest-performing, lowest-attrition teams - and which departments are showing early warning signals.
Abstract background with a diagonal split between light blue and dark navy blue colors.

DEI and Pay Equity Dashboard

Power BI HR Analytics dashboard
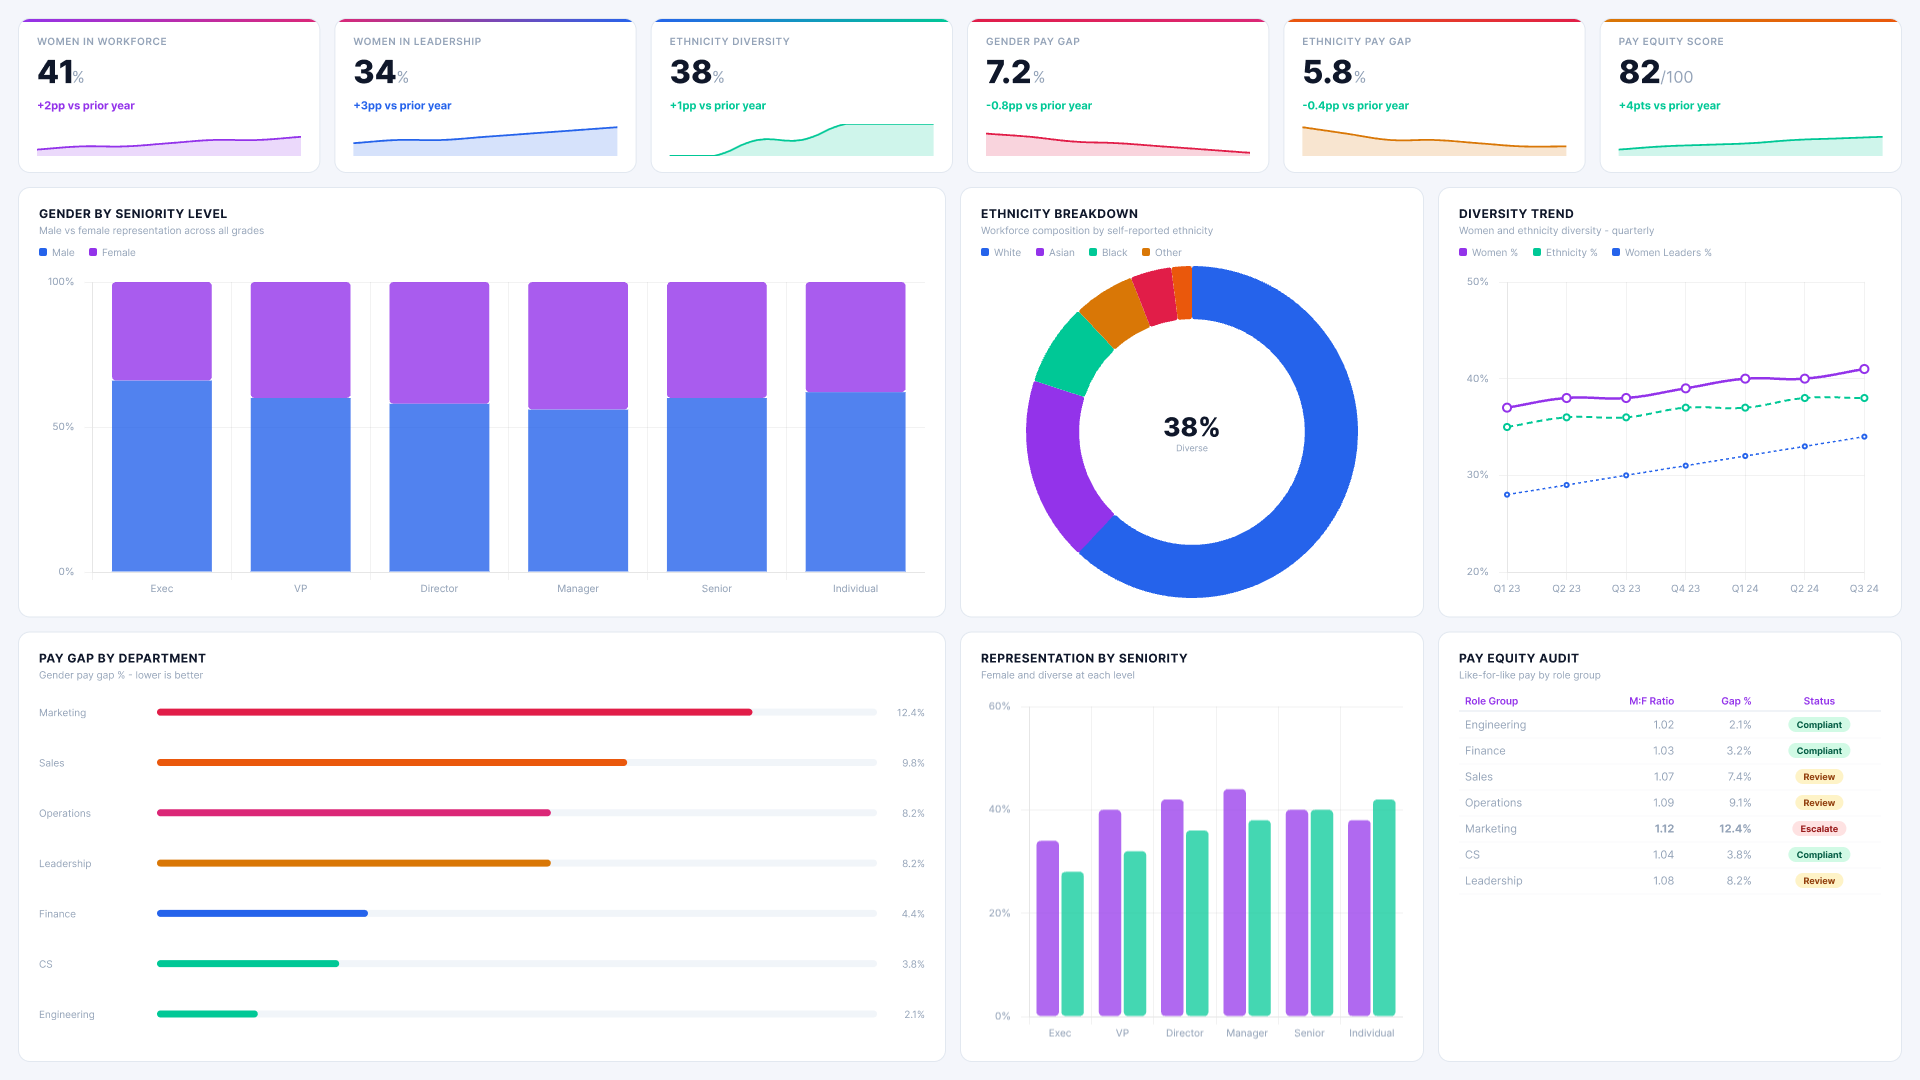
Monitor diversity representation and compensation equity across gender, ethnicity, tenure, and seniority. Identify pay gaps and representation gaps before they become compliance risks.
Build the business case for action with data leadership can stand behind - and stay ahead of audits rather than reacting to them.
Background Image of dark-section-bg-bottom

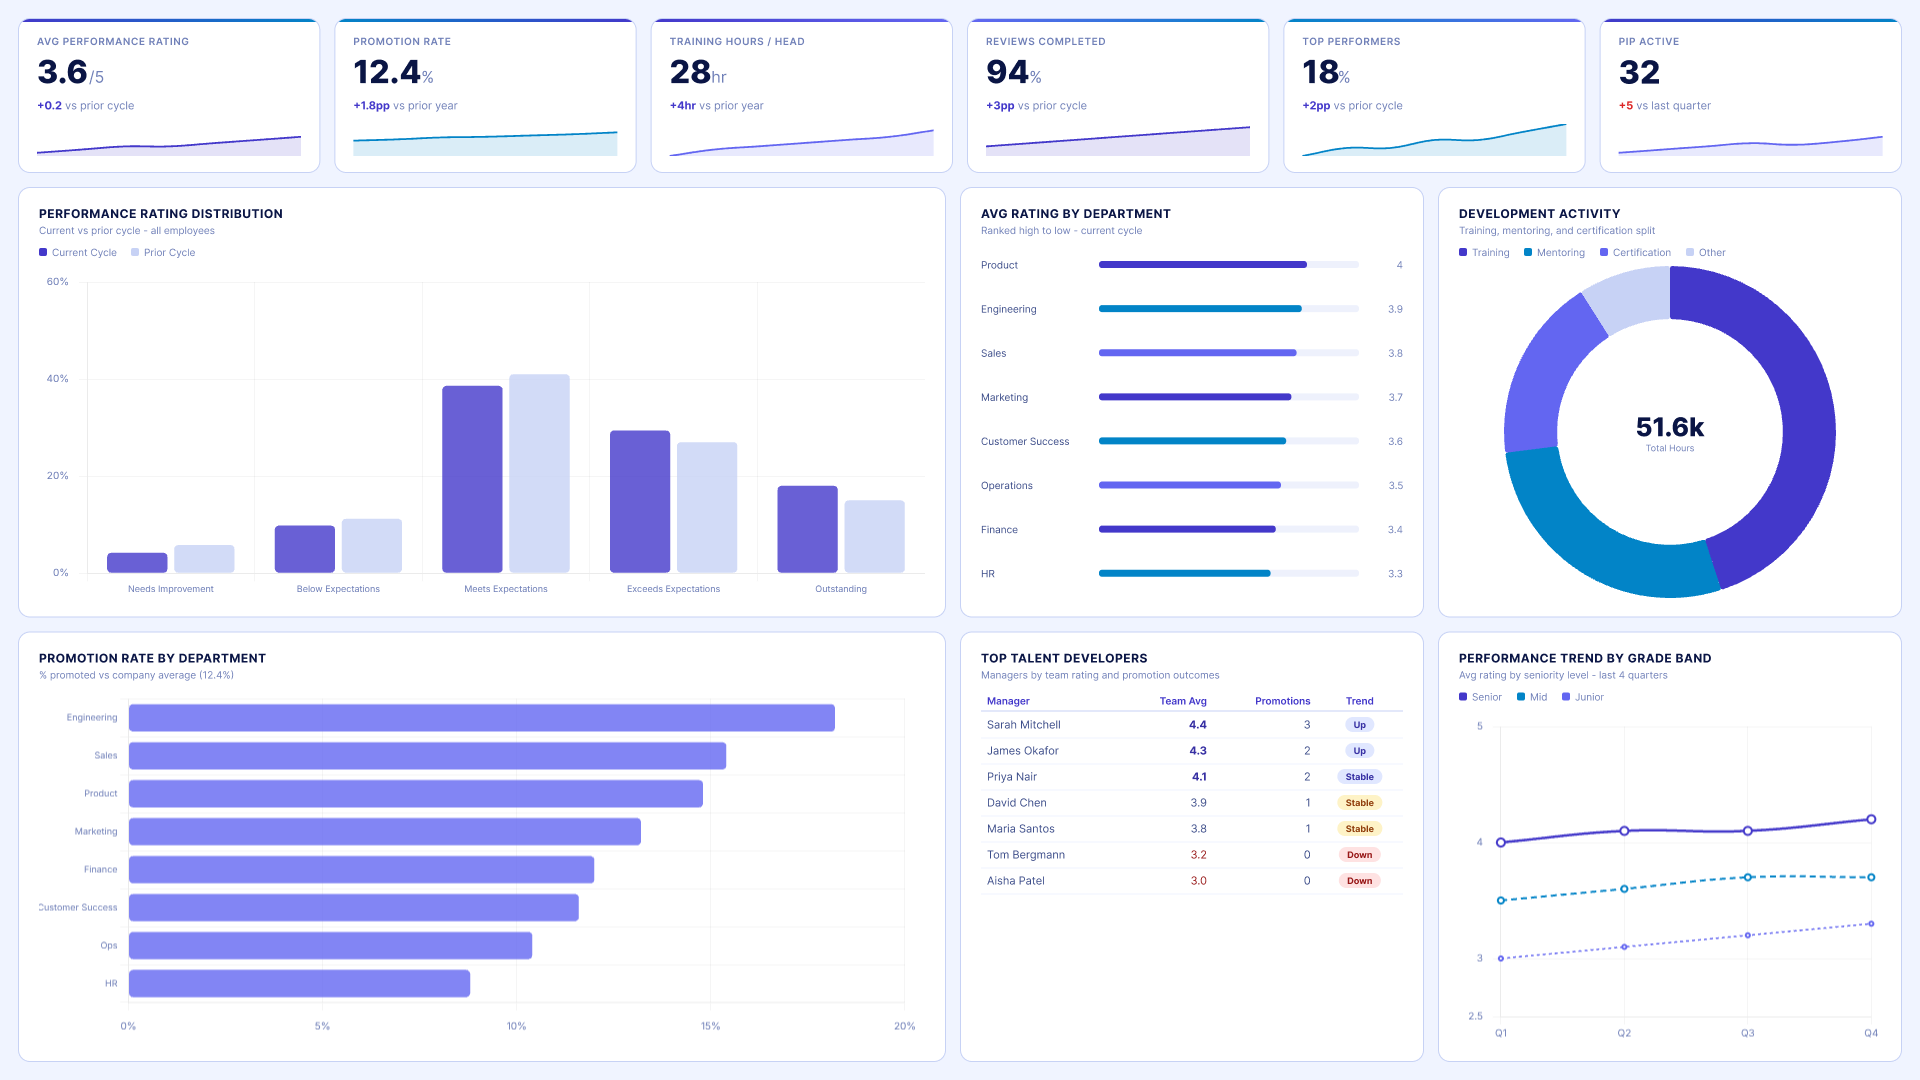
Performance and Development Dashboard
Power BI HR Analytics dashboard
Track performance ratings, promotion rates, and development activity at team and individual level. See which managers are building talent pipelines and which workforce segments are being underinvested in.
Prioritise where development spend will have the most impact - before top talent looks elsewhere.
Abstract background with a diagonal split between light blue and dark navy blue colors.

Headcount Planning Dashboard

Power BI HR Analytics dashboard
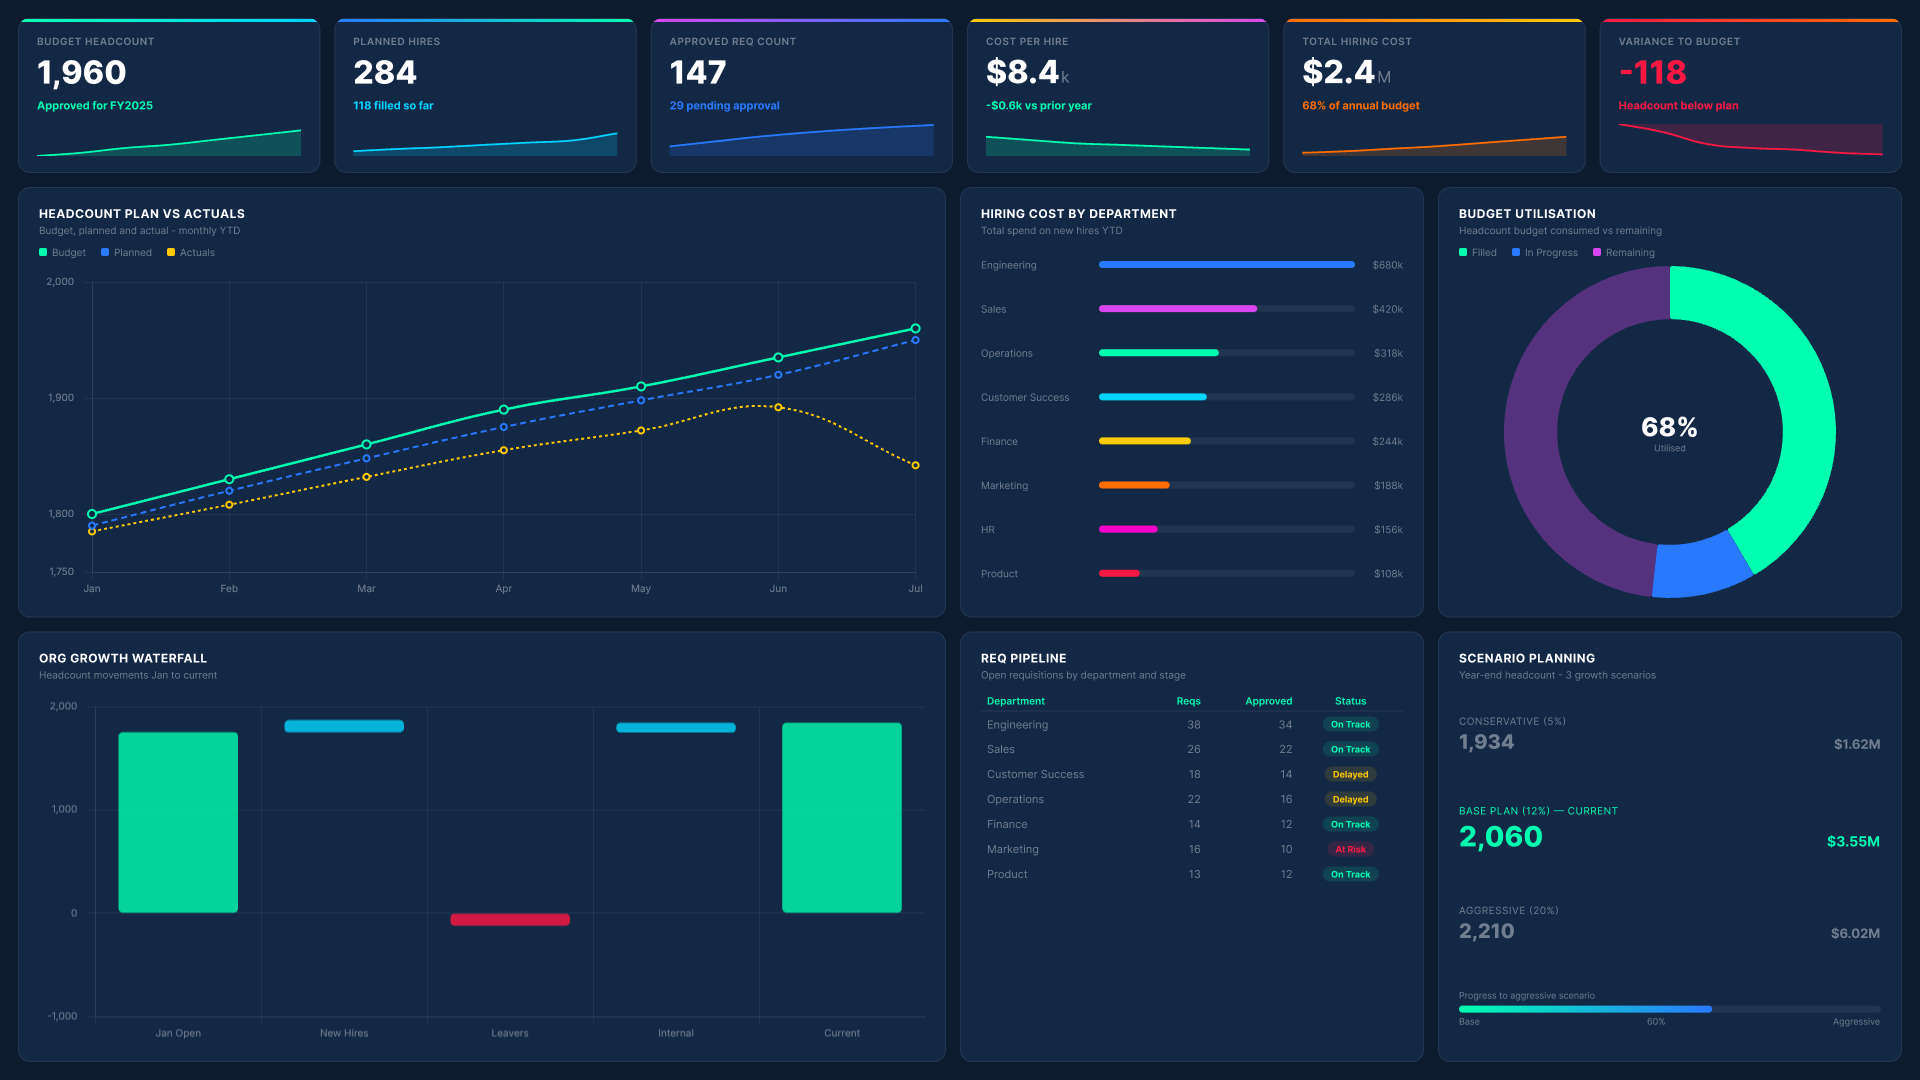
Model future headcount scenarios, hiring costs, and org structure changes against budget. Connect workforce planning directly to finance so every headcount decision is backed by numbers both teams can stand behind.
From conservative to aggressive growth scenarios - plan with confidence, not guesswork.
Background Image of dark-section-bg-bottom
THE SAME DATA, USEFUL FOR EVERY TEAM THAT TOUCHES IT

Built for every stakeholder in your people strategy

Icon
HR Business Partners
Monitor workforce health across assigned functions daily. Spot engagement drops, flag attrition risk in a specific manager's team, and prioritise outreach before an employee makes a decision to leave.
Icon
People Analytics Teams
Close the loop between workforce data and business outcomes. See which programmes and policies are moving the metrics that matter, and use that understanding to sharpen strategic recommendations and justify investment.
Icon
Leadership and Finance
Get the high-level view - attrition trends, headcount cost, and workforce productivity by segment - without requesting a report. Drill down when a number needs context, and connect headcount decisions directly to budget.
Icon
Talent Acquisition Teams
Connect hiring activity to downstream employee outcomes. Which sources produce candidates who stay? Which roles have the highest 90-day attrition? Those signals sharpen sourcing strategy, job design, and offer benchmarking.
Icon
Legal and Compliance Teams
Monitor pay equity and DEI metrics in real time. Representation gaps, unexplained compensation variance, and promotion rate disparities are visible before they surface in an audit - which is a materially different position to be in.
Icon
No New Tools. No New Training.
Reporting Hub is built on your existing Power BI environment. Filters, drill-downs, and segment comparisons are all built in. Every team member can explore the data without submitting a request to an analyst. Get a Free Trial

HR Analytics Dashboard FAQs

Can the dashboard track employees across multiple entities, regions, or HR systems?

Yes, it connects multiple HRIS, payroll, and regional systems. Filters enable teams to focus on relevant workforce populations.

How is employee data kept secure when shared across teams or with external parties?

Row-level security ensures users only access permitted data. Sensitive compensation and performance data remains fully protected at all times.

Can we customize which metrics appear for different HR teams or business units?

You can fully customize metrics, layout, and detail level per audience, from HR teams to executive board reporting views.

Does it work if our HR data sits in multiple systems with different structures?

Yes. It connects multiple data sources and existing Power BI models without requiring consolidation, migration, or restructuring of HR systems.

Can we set up alerts when a key workforce metric changes significantly?

Configure alerts for attrition spikes, engagement drops, or headcount changes, notifying relevant teams instantly so action can be taken.