Five golden stars arranged in a horizontal row.
Educational BI Content from Reporting Hub

Power BI Finance Dashboard – Real-Time Financial Insights

Know Your Numbers, the Moment They Change

A Power BI finance dashboard helps you see and understand your financial data in one clear place. Instead of digging through spreadsheets, you get real-time numbers shown in simple, visual reports you can interact with.

With automatic data updates and views tailored to your business, you can spot trends faster and make better financial decisions for steady growth and stronger profits.

Smiling man with short dark hair wearing a dark shirt against a blue gradient background.
Brian DeLuca
15 min read . March 1, 2025
Power BI finance dashboard overview showing revenue, KPIs, and budget variance

Know Your Numbers In Real Time with Power BI Finance Dashboard

A Power BI finance dashboard gives you a clear view of your company's financial health. It pulls live data from your systems and turns key numbers into easy-to-read, interactive visuals.
Instead of jumping between tools or reports, everything is brought into one place. Even complex financial data becomes simple to follow, so you can understand what's happening and act with confidence.

Financial Metrics, Always Up to Date

You can track revenue performance, expense patterns, profit margins, cash positions, budget adherence, and financial trends in real time.
Bar chart icon
Revenue & Sales Performance
See total revenue, revenue by product or service, and sales growth as it happens.
Invoice icon
Expenses & Cost Breakdown
Track spending by category, department, or vendor, and drill into where money is going.
Pie chart icon
Profit & Margin Trends
Monitor gross, operating, and net profit over time and across business units.
Cash with exchange arrows icon
Cash Flow & Cash Position
Follow money in and out of the business and see your current cash position instantly.
Bar chart icon
Budget vs Actual Performance
Compare planned budgets with actual results, with variances calculated automatically.
Upward trend chart icon
Monthly, Quarterly & Yearly Trends
View performance across time periods to spot seasonal and long-term patterns.
Abstract background with a diagonal split between light blue and dark navy blue colors.

A Finance Dashboard Solves

Before it's a set of visuals, a finance dashboard is a fix for the everyday friction finance teams run into.

Clock with warning icon
Delayed Reporting

Financial reporting that lags weeks behind the numbers it's meant to reflect.

Clipboard with pencil icon
Manual Errors

Manual data entry mistakes that quietly compound across spreadsheets.

Broken link icon
Disconnected Sources

Data scattered across disconnected systems with no single source of truth.

Spending chart icon
Spending Blind Spots

Limited visibility into where and how money is actually being spent.

Hourglass icon
Slow Report Generation

Time-consuming report generation that pulls analysts away from analysis.

Chart icon
Missed Trends

Difficulty spotting financial trends before they become financial problems.

Background Image of dark-section-bg-bottom

7 Essential Power BI Finance Dashboard Examples

The dashboards focus on the most important areas of financial management. Together, they give you a clear picture of your company's financial health and performance.

Revenue Dashboard
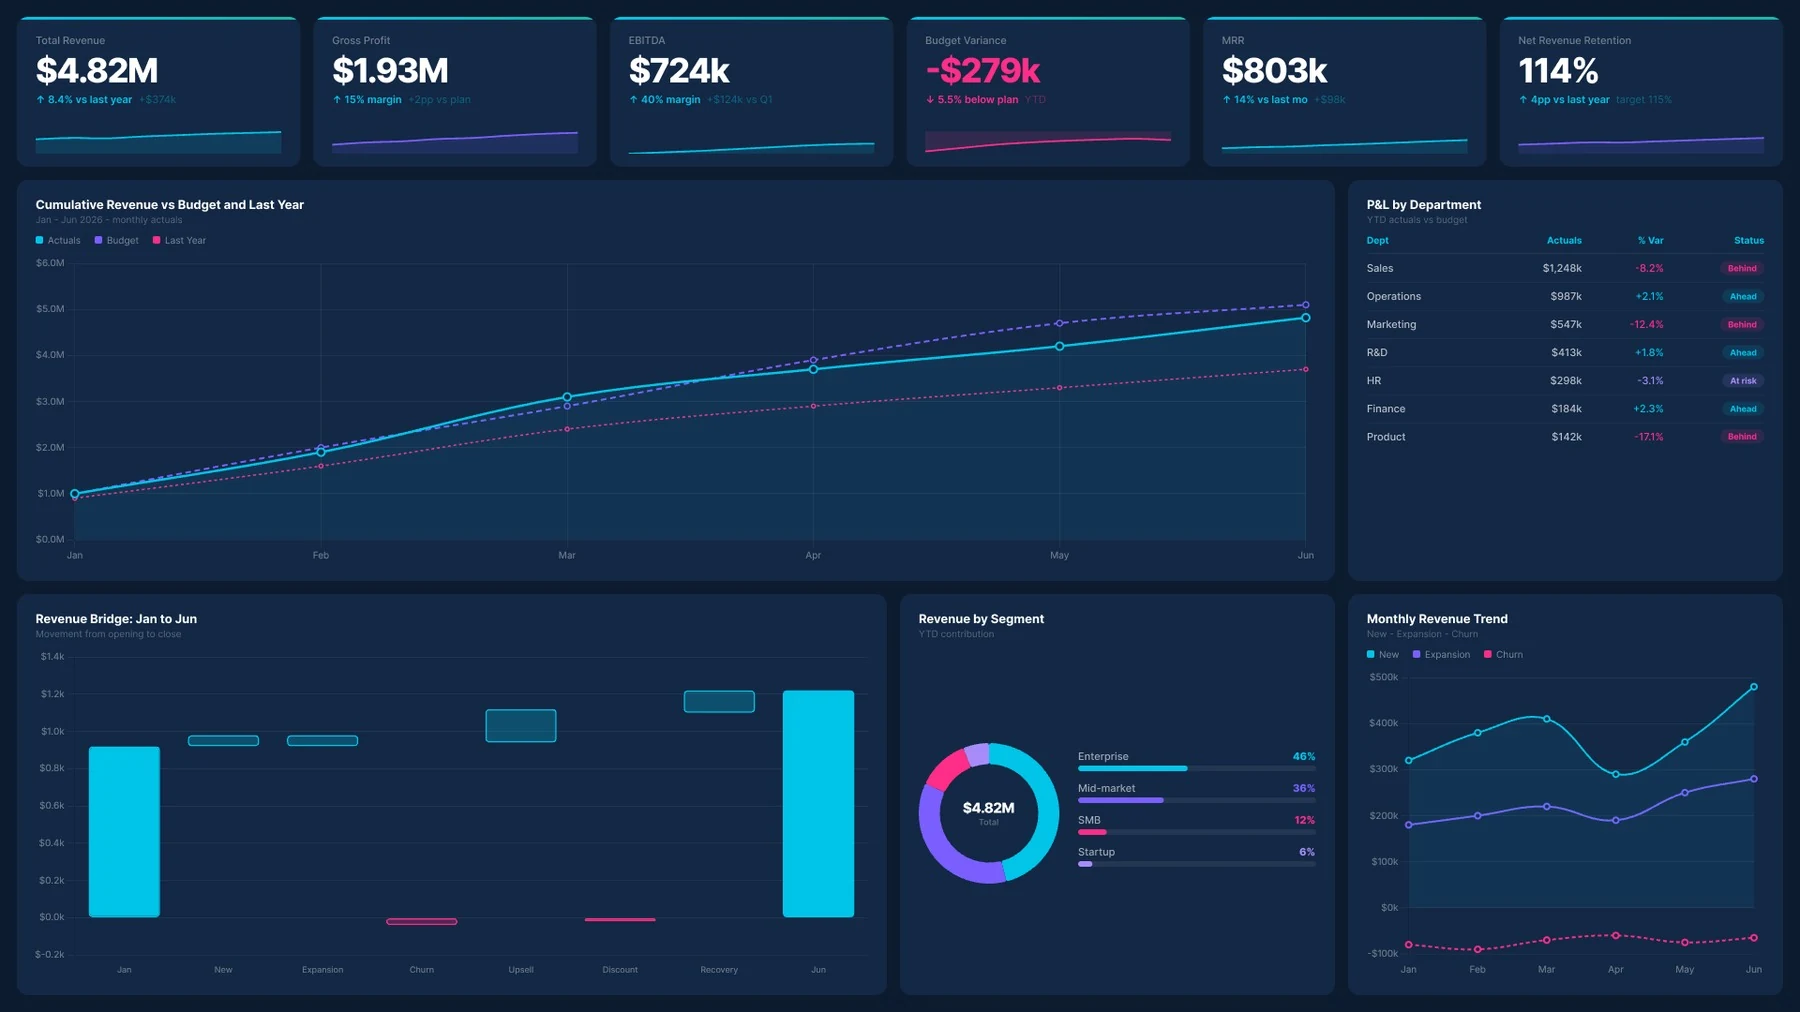
Revenue dashboard in Power BI showing cumulative revenue vs budget and last year
Get a complete view of where your income comes from. Track revenue by product, region, customer group, or sales channel.
This helps finance and sales teams spot growth opportunities and quickly see what's not performing as expected.
Abstract background with a diagonal split between light blue and dark navy blue colors.

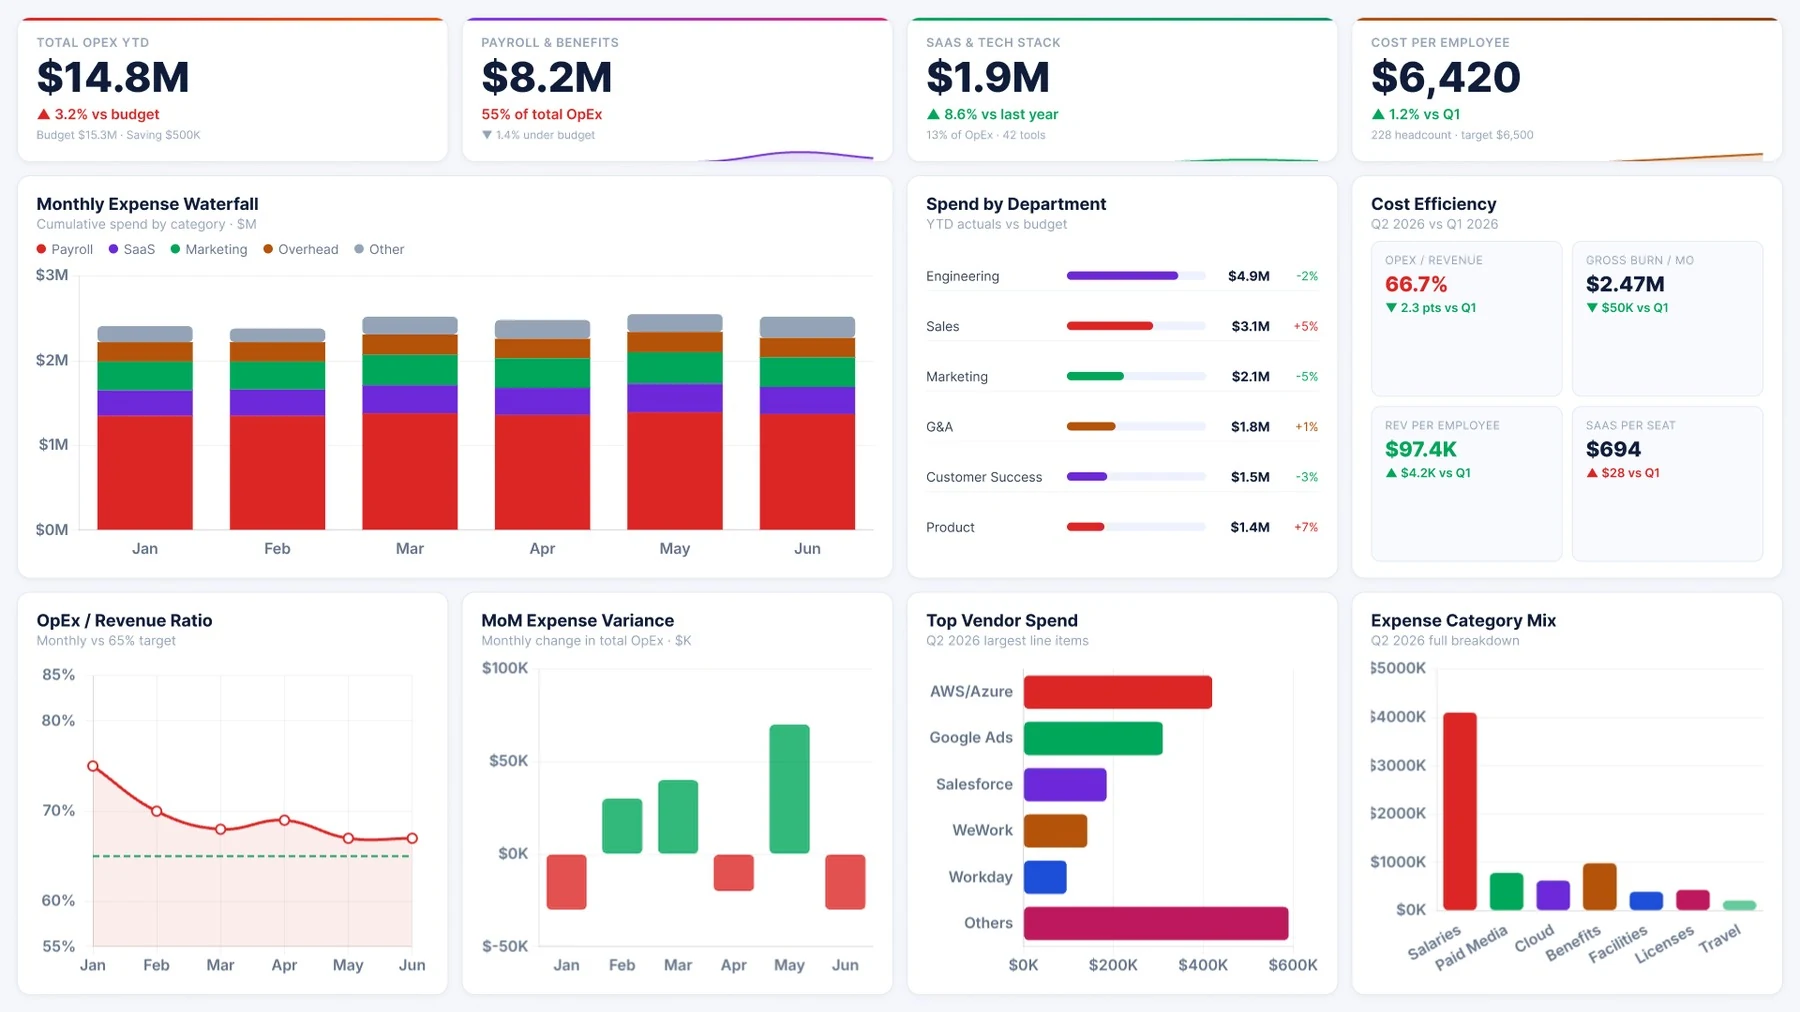
 Expense Dashboard

Expense dashboard in Power BI showing monthly expense waterfall and spend by department
See exactly where your money is going. Expenses are grouped by category, department, vendor, or project.
This makes it easy to control costs, track spending against budgets, and stay compliant with company policies.
Background Image of dark-section-bg-bottom

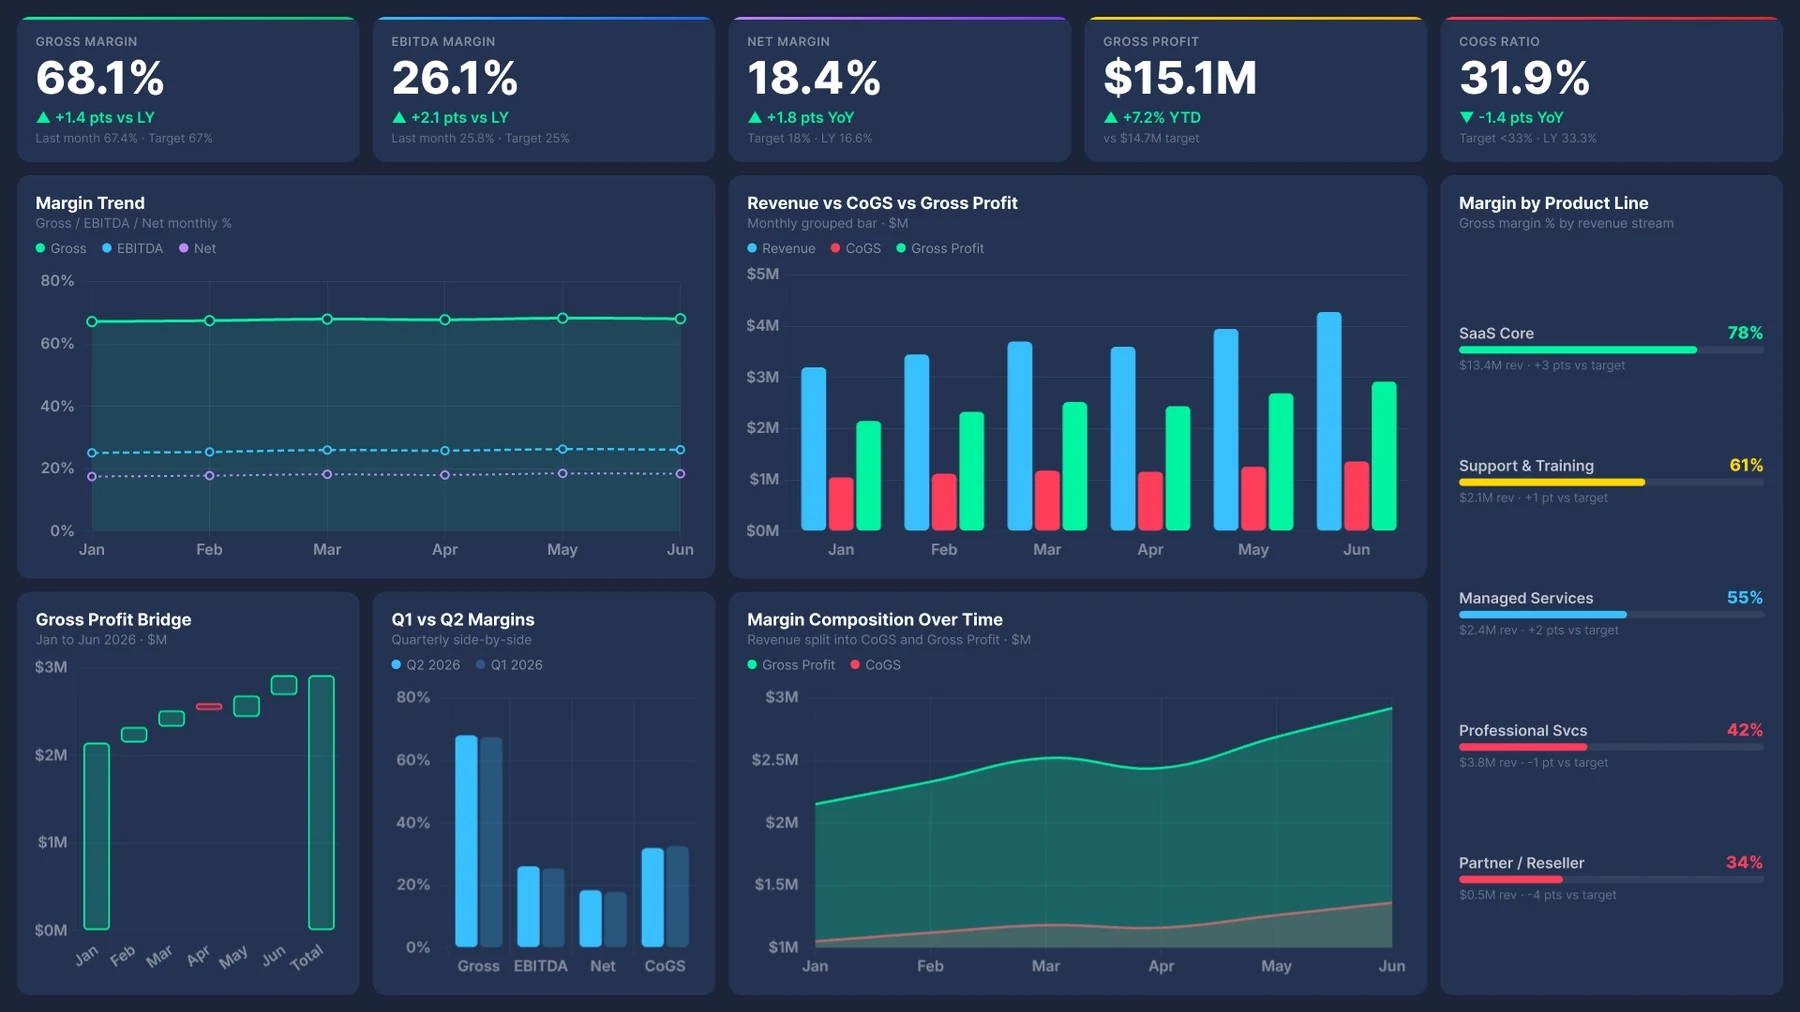
Profit & Margin Dashboard

Profit and margin dashboard in Power BI showing gross margin, EBITDA margin, and net margin trends
Understand what actually drives your profits: track gross profit, operating profit, and net profit with precise margin percentages.
Analyze profitability by product, customer, or business unit to see what really impacts the bottom line.
Abstract background with a diagonal split between light blue and dark navy blue colors.

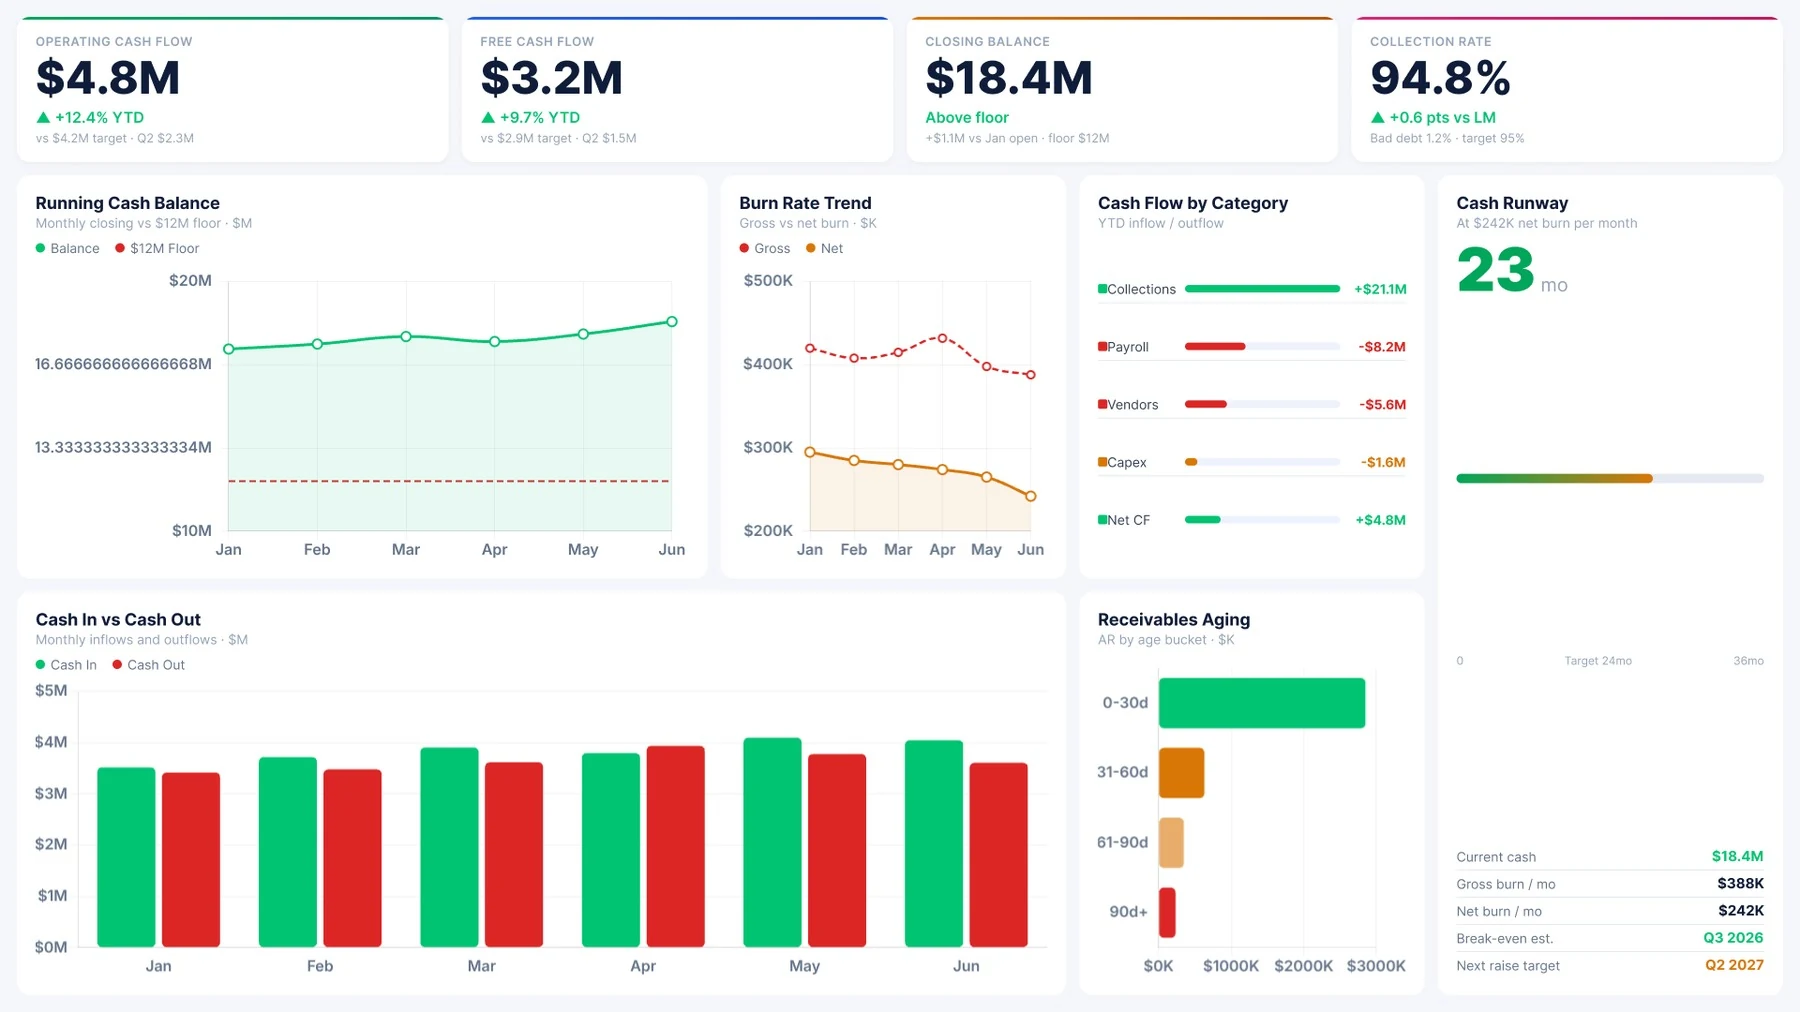
Cash Flow Dashboard

Cash flow dashboard in Power BI showing operating cash flow, free cash flow, and cash runway
Stay on top of your cash at all times. Monitor cash coming in and going out, see your current cash position, and plan for future needs.
This Power BI finance dashboard helps prevent cash shortages and improve payment timing.
Background Image of dark-section-bg-bottom

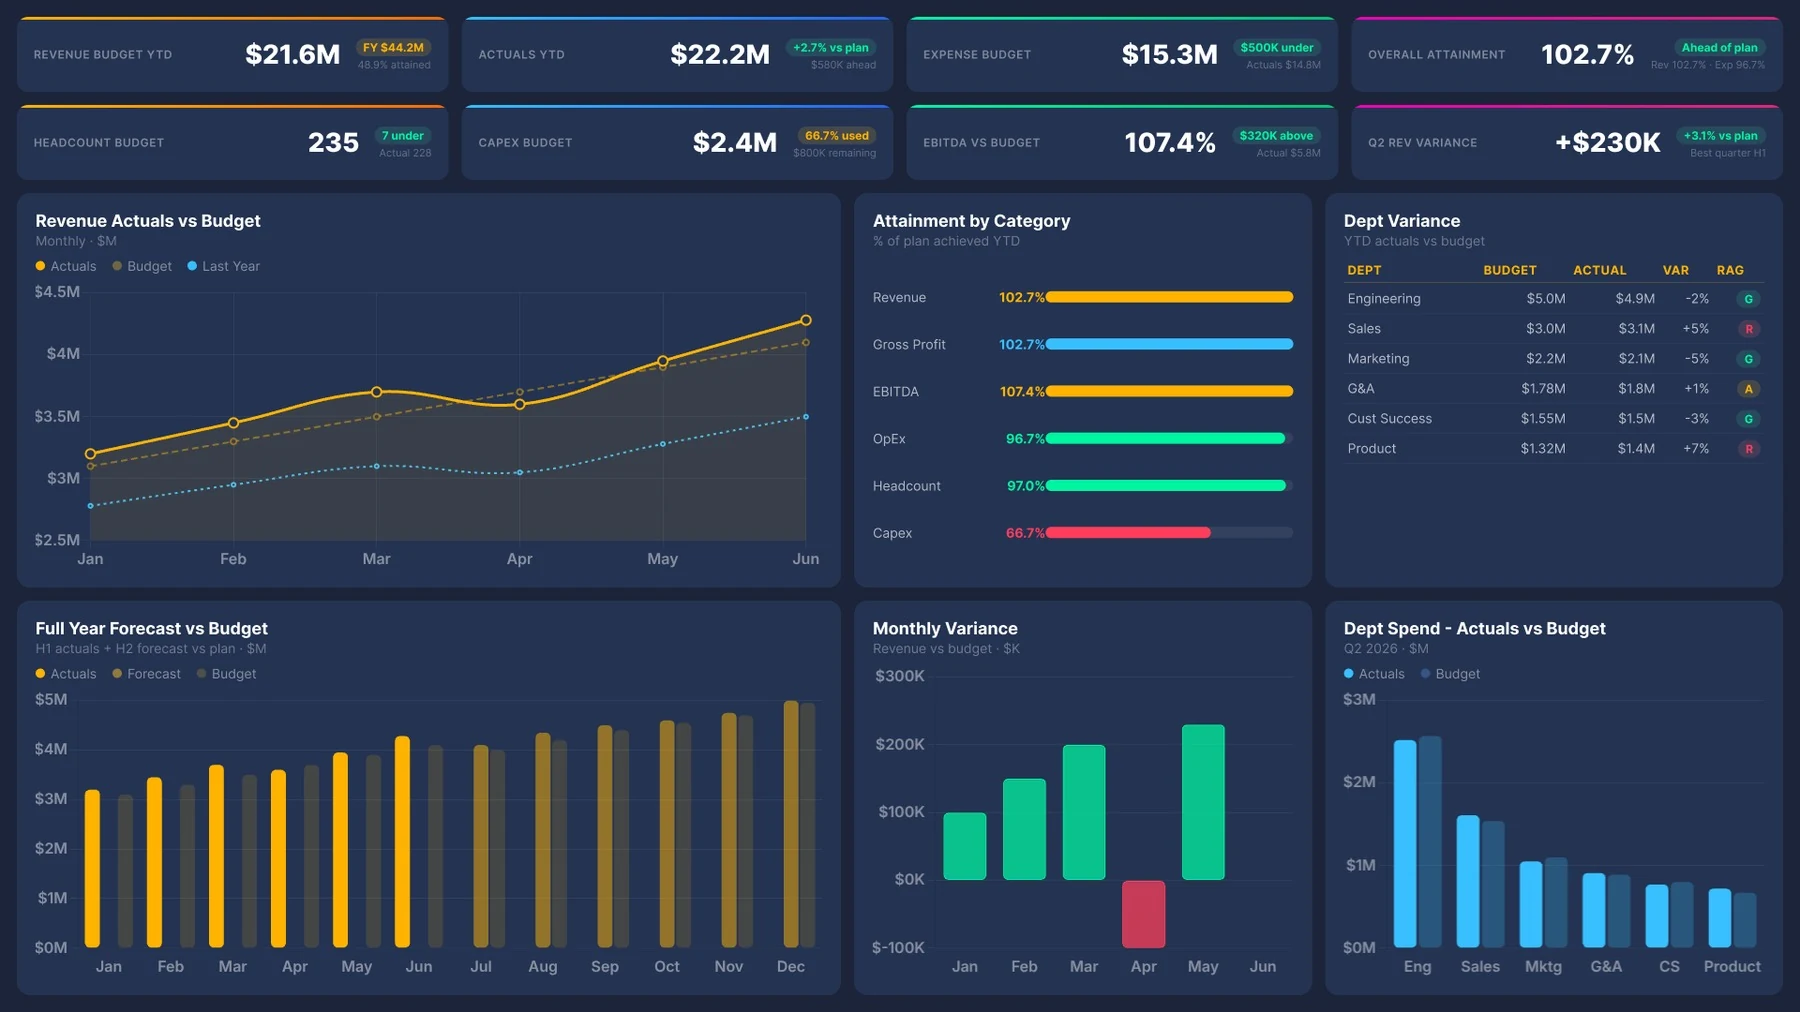
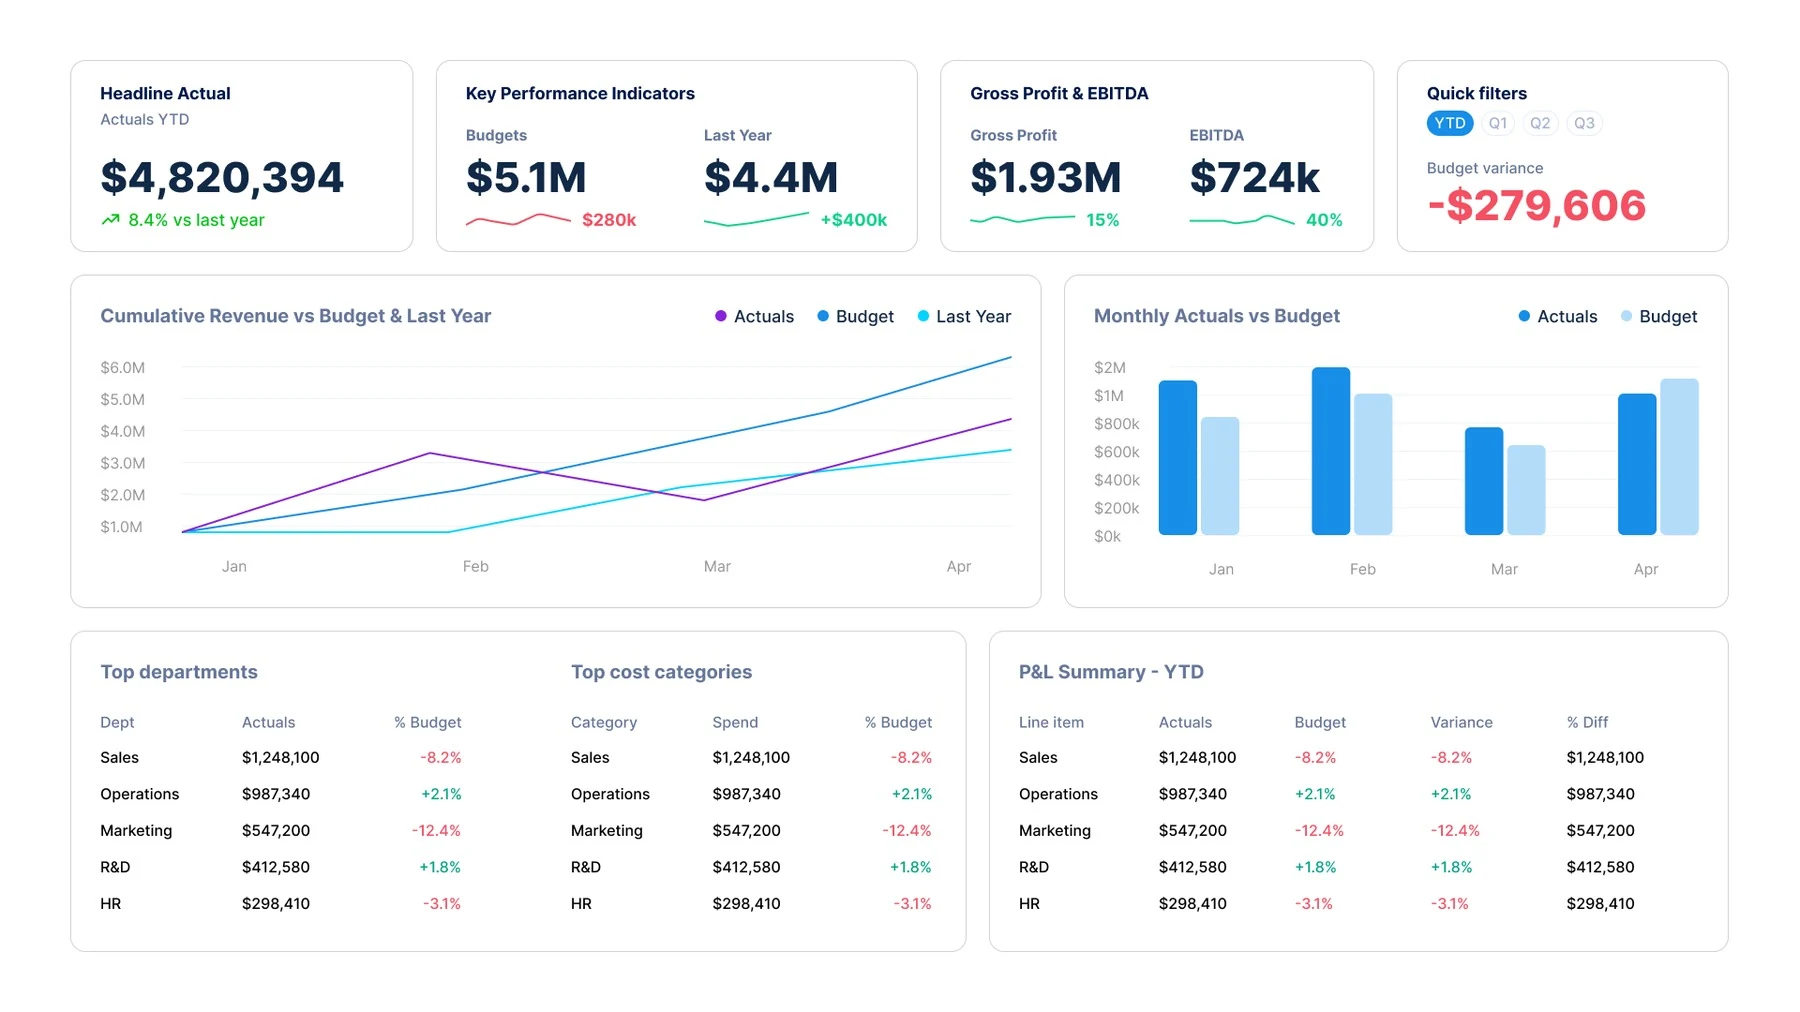
Budget vs Actual Dashboard

Budget vs actual dashboard in Power BI showing revenue budget YTD and attainment by category
Compare planned budgets with actual results side by side. Instantly spot differences and understand why they happened.
Take action early — before small gaps turn into bigger problems.

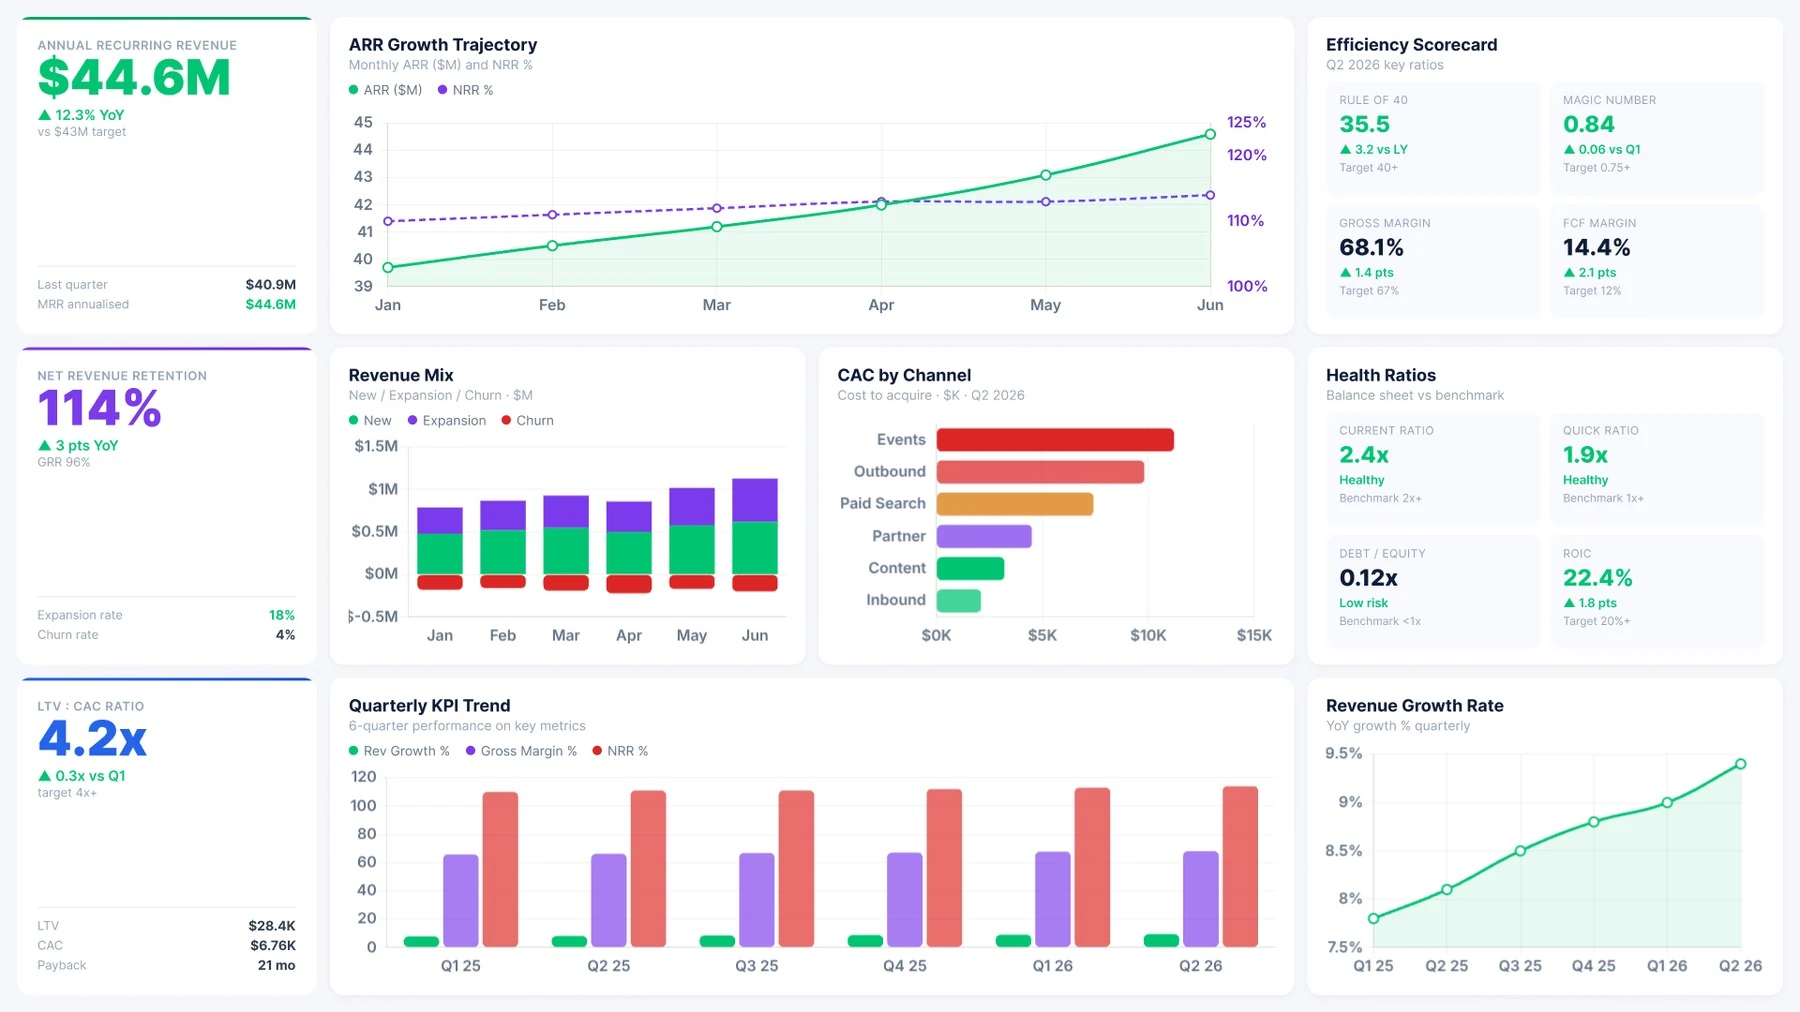
Financial KPI Dashboard

Financial KPI dashboard in Power BI showing ARR growth trajectory and efficiency scorecard
Get a high-level view of your most important financial metrics in one place.
Track key indicators such as return on investment, debt levels, and efficiency metrics to assess overall business health quickly.
Abstract background with a diagonal split between light blue and dark navy blue colors.

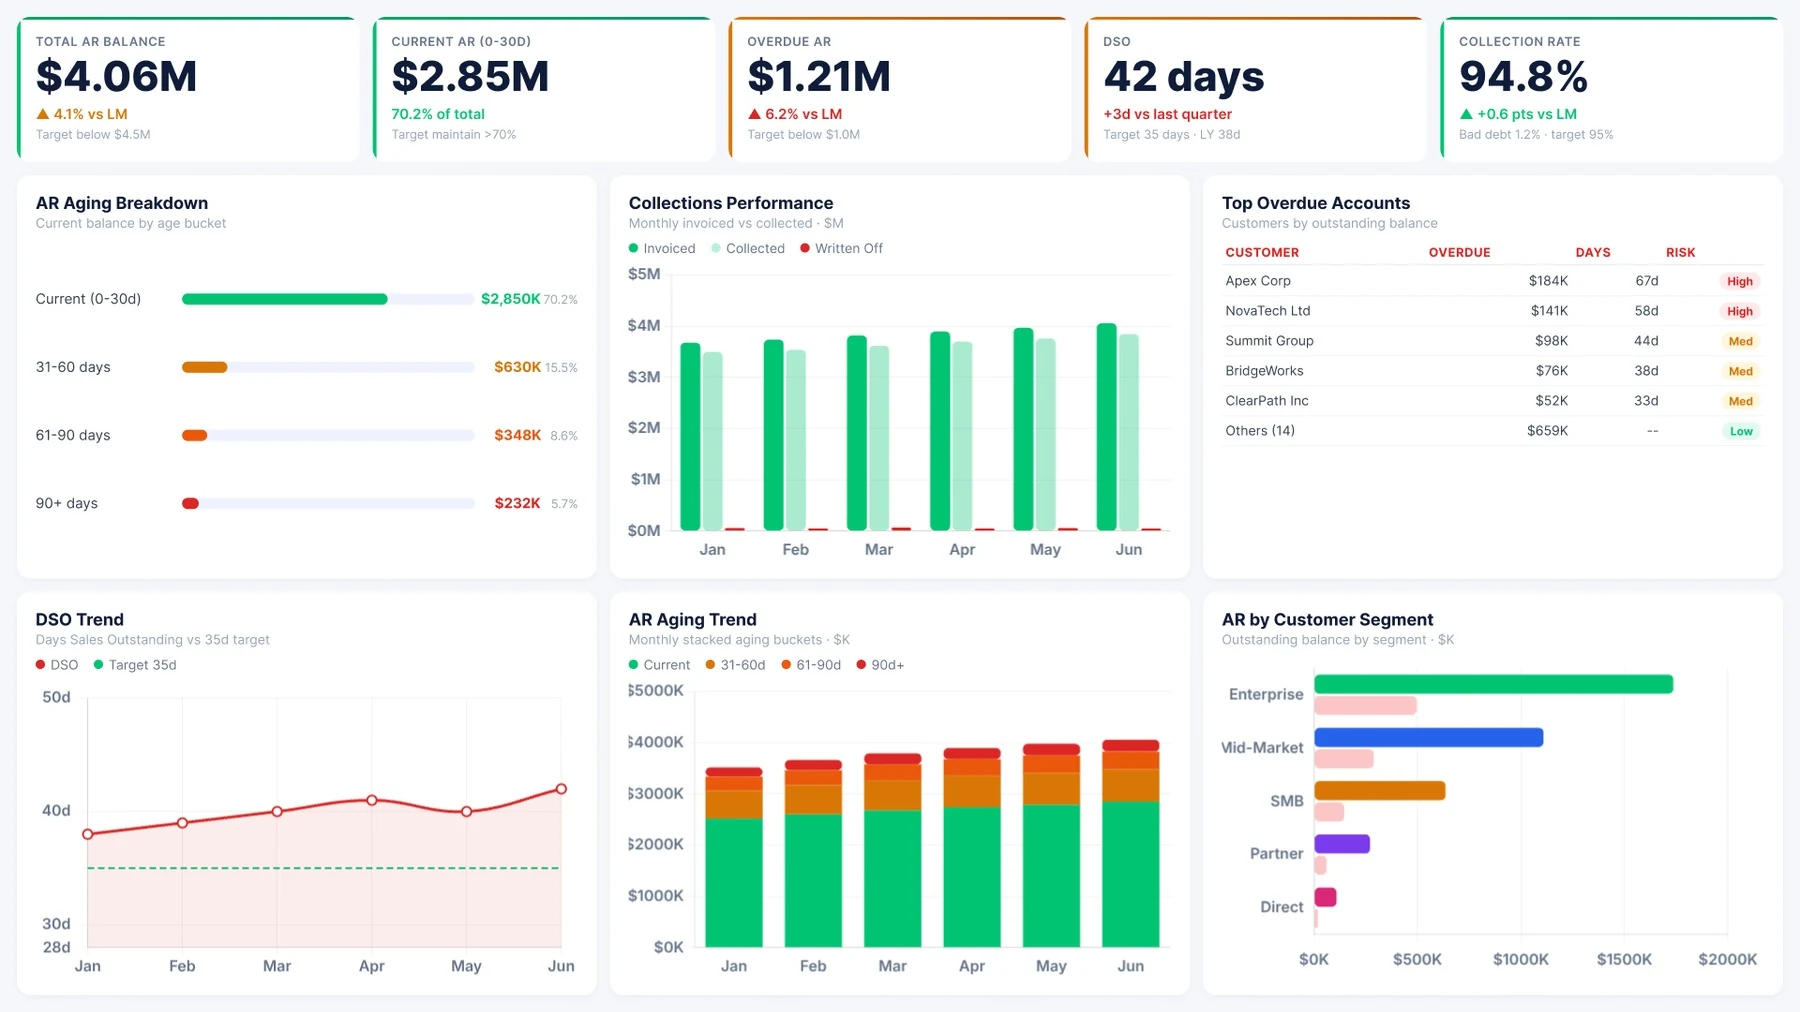
Accounts Receivable Dashboard

Accounts receivable dashboard in Power BI showing AR aging breakdown and collections performance
Keep track of unpaid invoices and customer payment behavior. See aging receivables and identify late payments.
Focus collection efforts on high-value or overdue accounts to improve cash flow.
Background Image of dark-section-bg-bottom

Get Started with Power BI Finance Dashboards

Upgrade the way you track finances and make decisions with Power BI dashboards built for real-time insight. See what's happening in your business as it happens — and act faster with confidence.
The Reporting Hub delivers ready-to-use Power BI finance dashboards designed around your business needs. They're quick to set up, easy to use, and built to help your team get value from data right away.