Power BI Marketing Campaign Dashboard - Real-Time Campaign Performance

A Power BI marketing campaign dashboard puts every campaign in one place. Instead of jumping between ad platforms, spreadsheets, and analytics tools, you get a single live view of what your marketing budget is doing and what it is producing.

You can see channel performance, cost data, lead volume, and conversion rates as they update. Manual reporting slows decisions down. This replaces it with a connected, always-current view your marketing and leadership teams can actually use.

Smiling man with short dark hair wearing a dark shirt against a blue gradient background.
Brian DeLuca
10 min read . July 2025
Power BI marketing analytics dashboard showing campaign performance overview
SEE CAMPAIGN PERFORMANCE IN REAL TIME

A marketing campaign dashboard built on Power BI solves these problems

Icon
Manually pulling reports from five different ad platforms every week
Icon
Campaign data that is outdated before it reaches the person who needs it
Icon
No single view of cost, reach, and revenue across all active campaigns
Icon
Inconsistent metrics between marketing, finance, and sales
Icon
Slow decisions caused by fragmented dashboards that do not talk to each other
Icon
Difficulty proving ROI when attribution data is scattered across tools

Marketing Metrics, Always Up to Date

Track the numbers that matter most - from budget spend to pipeline contribution - without lifting a finger to refresh or rebuild a report.

Campaign Overview Dashboard
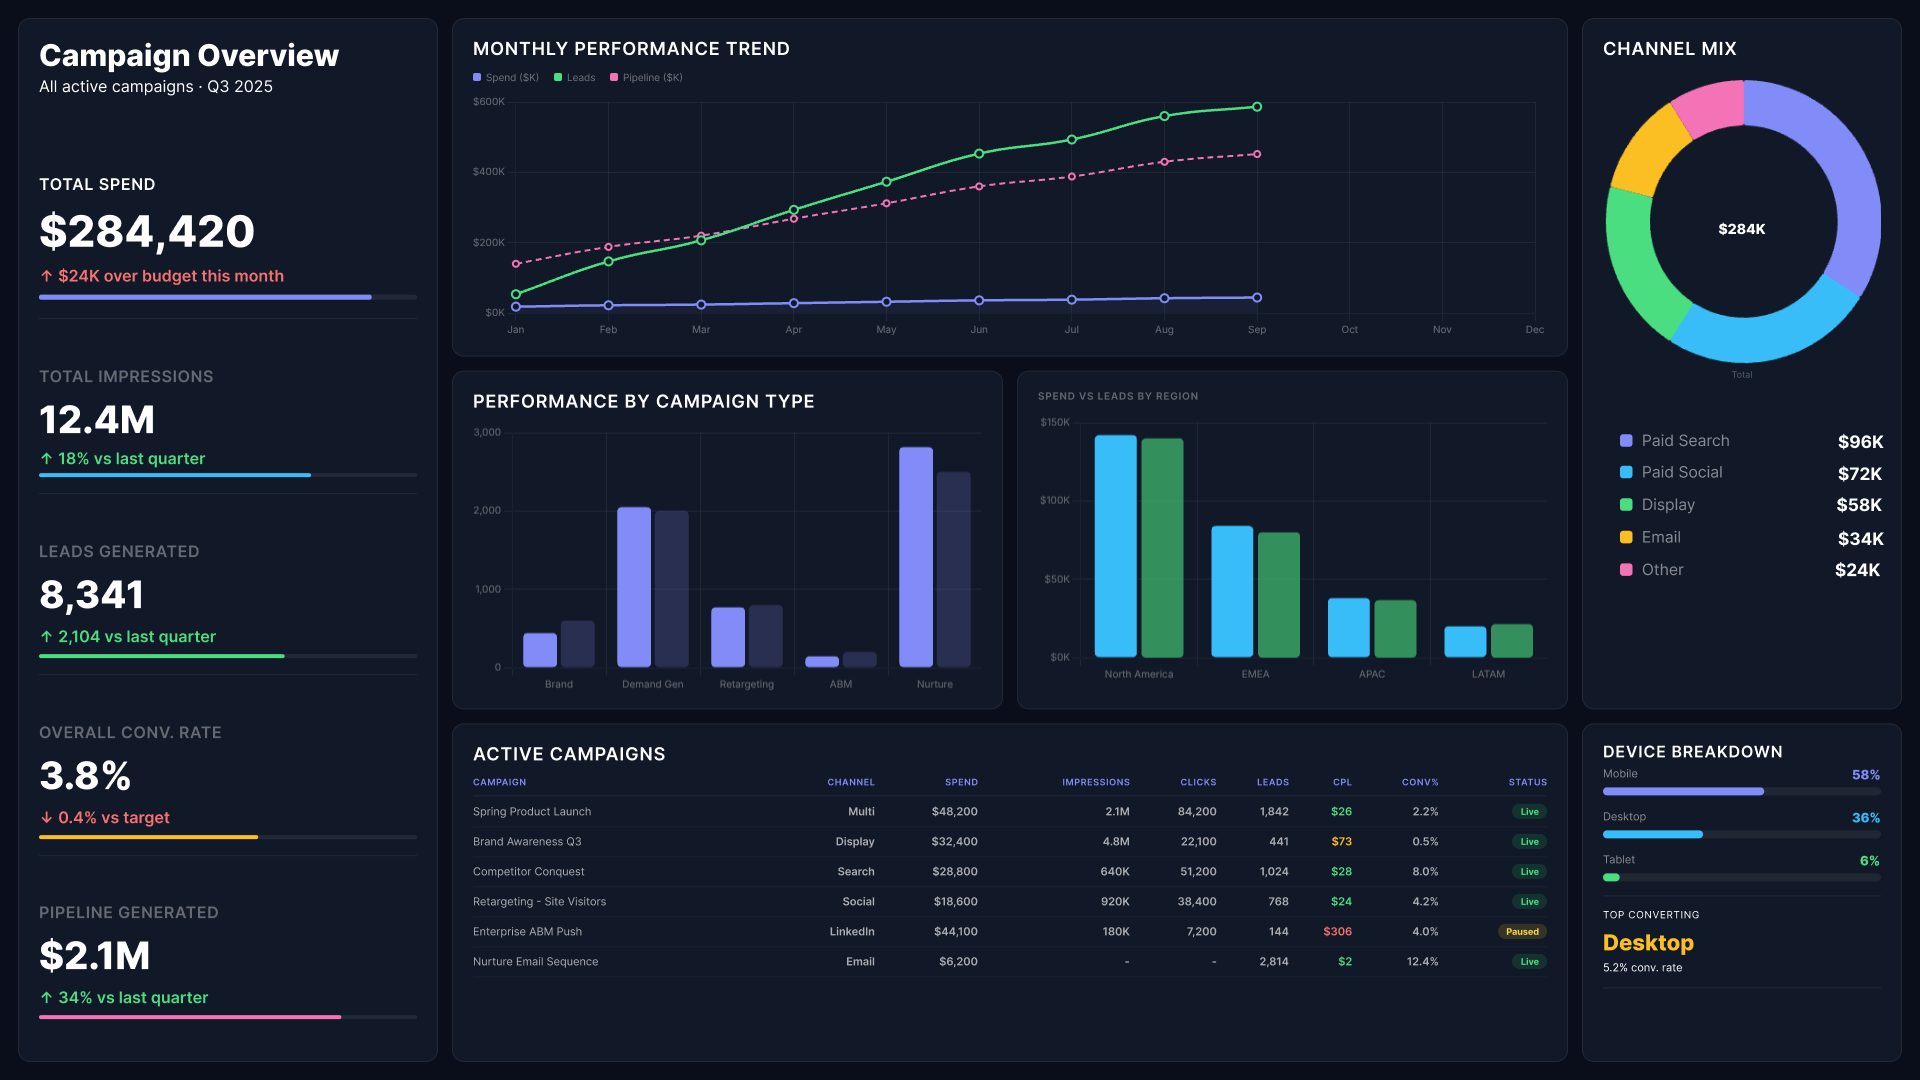
Power BI marketing analytics dashboard showing campaign overview with spend, impressions, and pipeline
Get a top-level view of all active campaigns in one place. See total spend, impressions, clicks, and leads by campaign with filters for date range, channel, and team. This gives marketing leaders the summary they need without opening every individual platform.
There is no waiting for exports or manually building pivot tables. The numbers update automatically so your team is always looking at the current picture, not last week's version of it.
Abstract background with a diagonal split between light blue and dark navy blue colors.

Paid Media Performance Dashboard

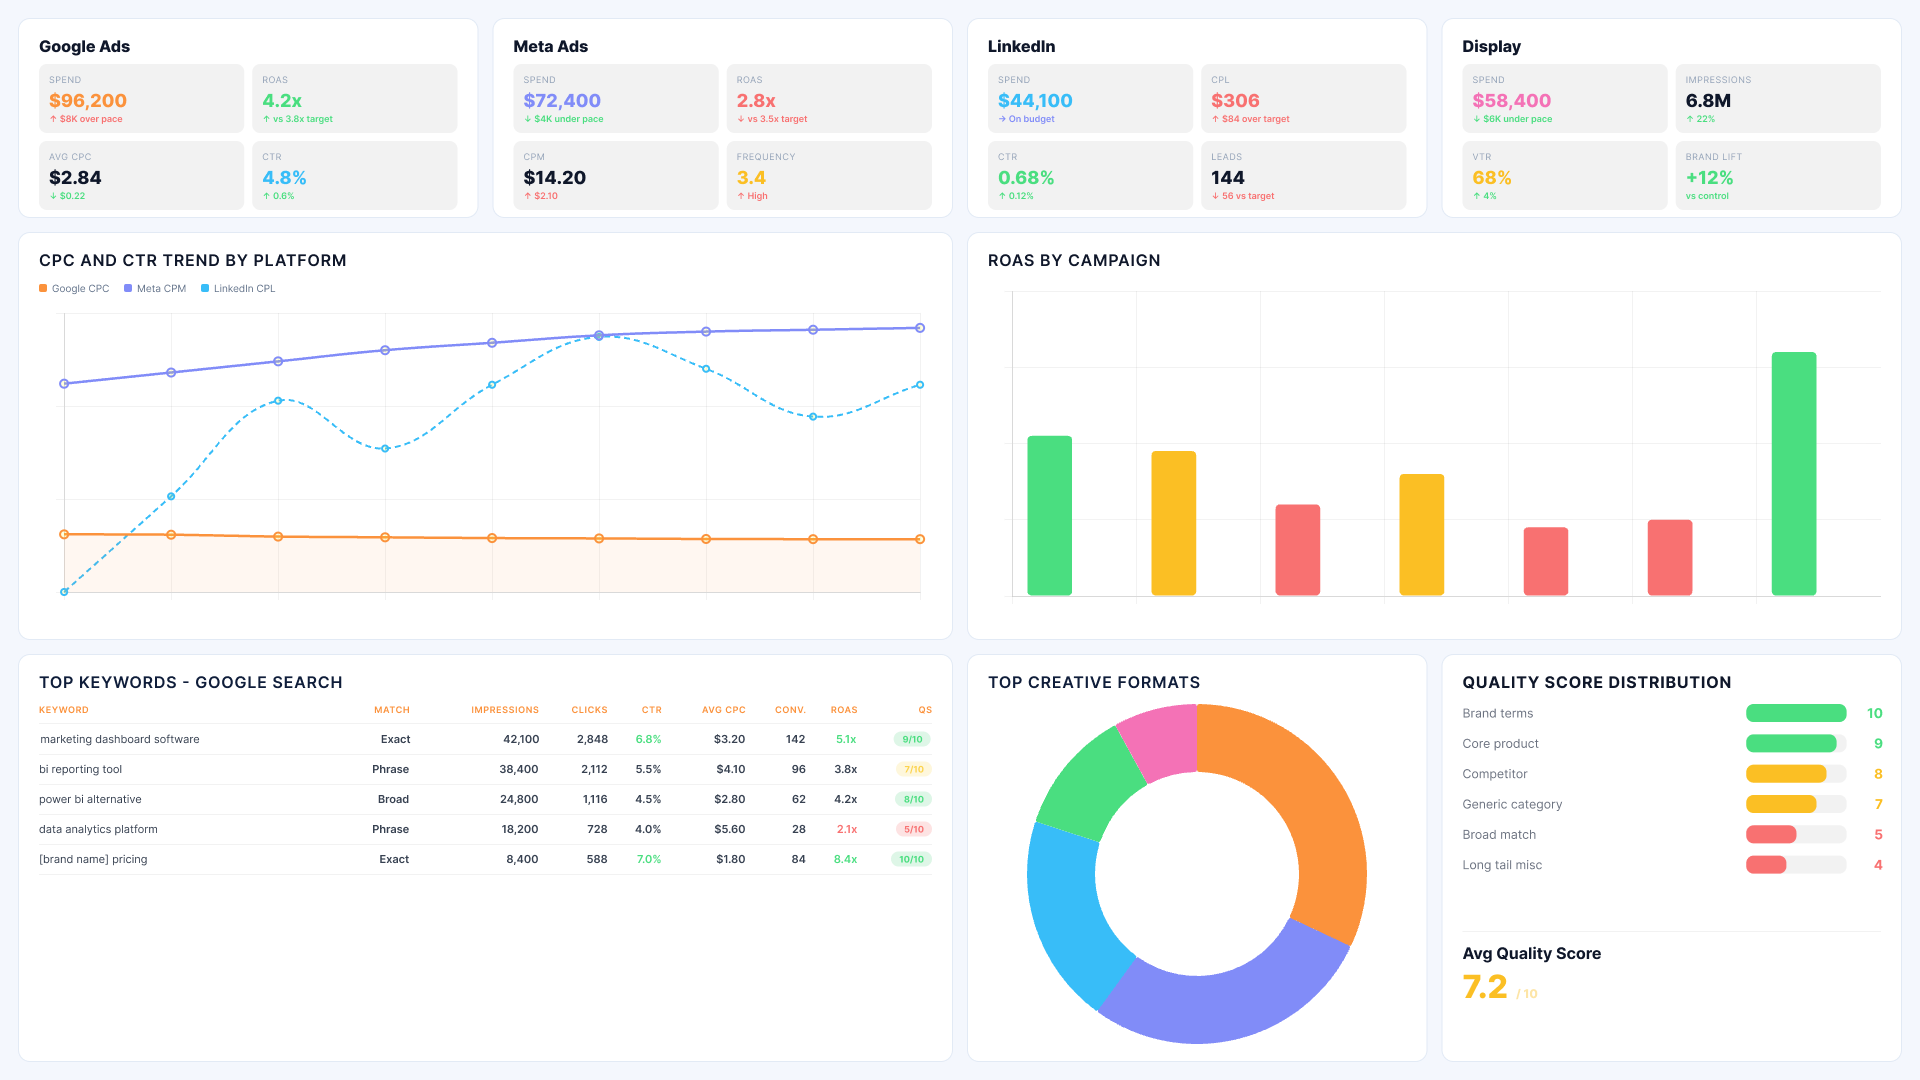
Power BI marketing analytics dashboard showing paid media performance across Google, Meta and LinkedIn
Track paid search and social campaign performance in detail. Monitor cost per click, quality scores, ad group performance, and conversion rates. Use this to find which paid campaigns are delivering pipeline and which are burning budget.
Campaign spend and budget tracking side by side - spot overspend early and reallocate budget before it runs away from you.

Lead Generation Dashboard

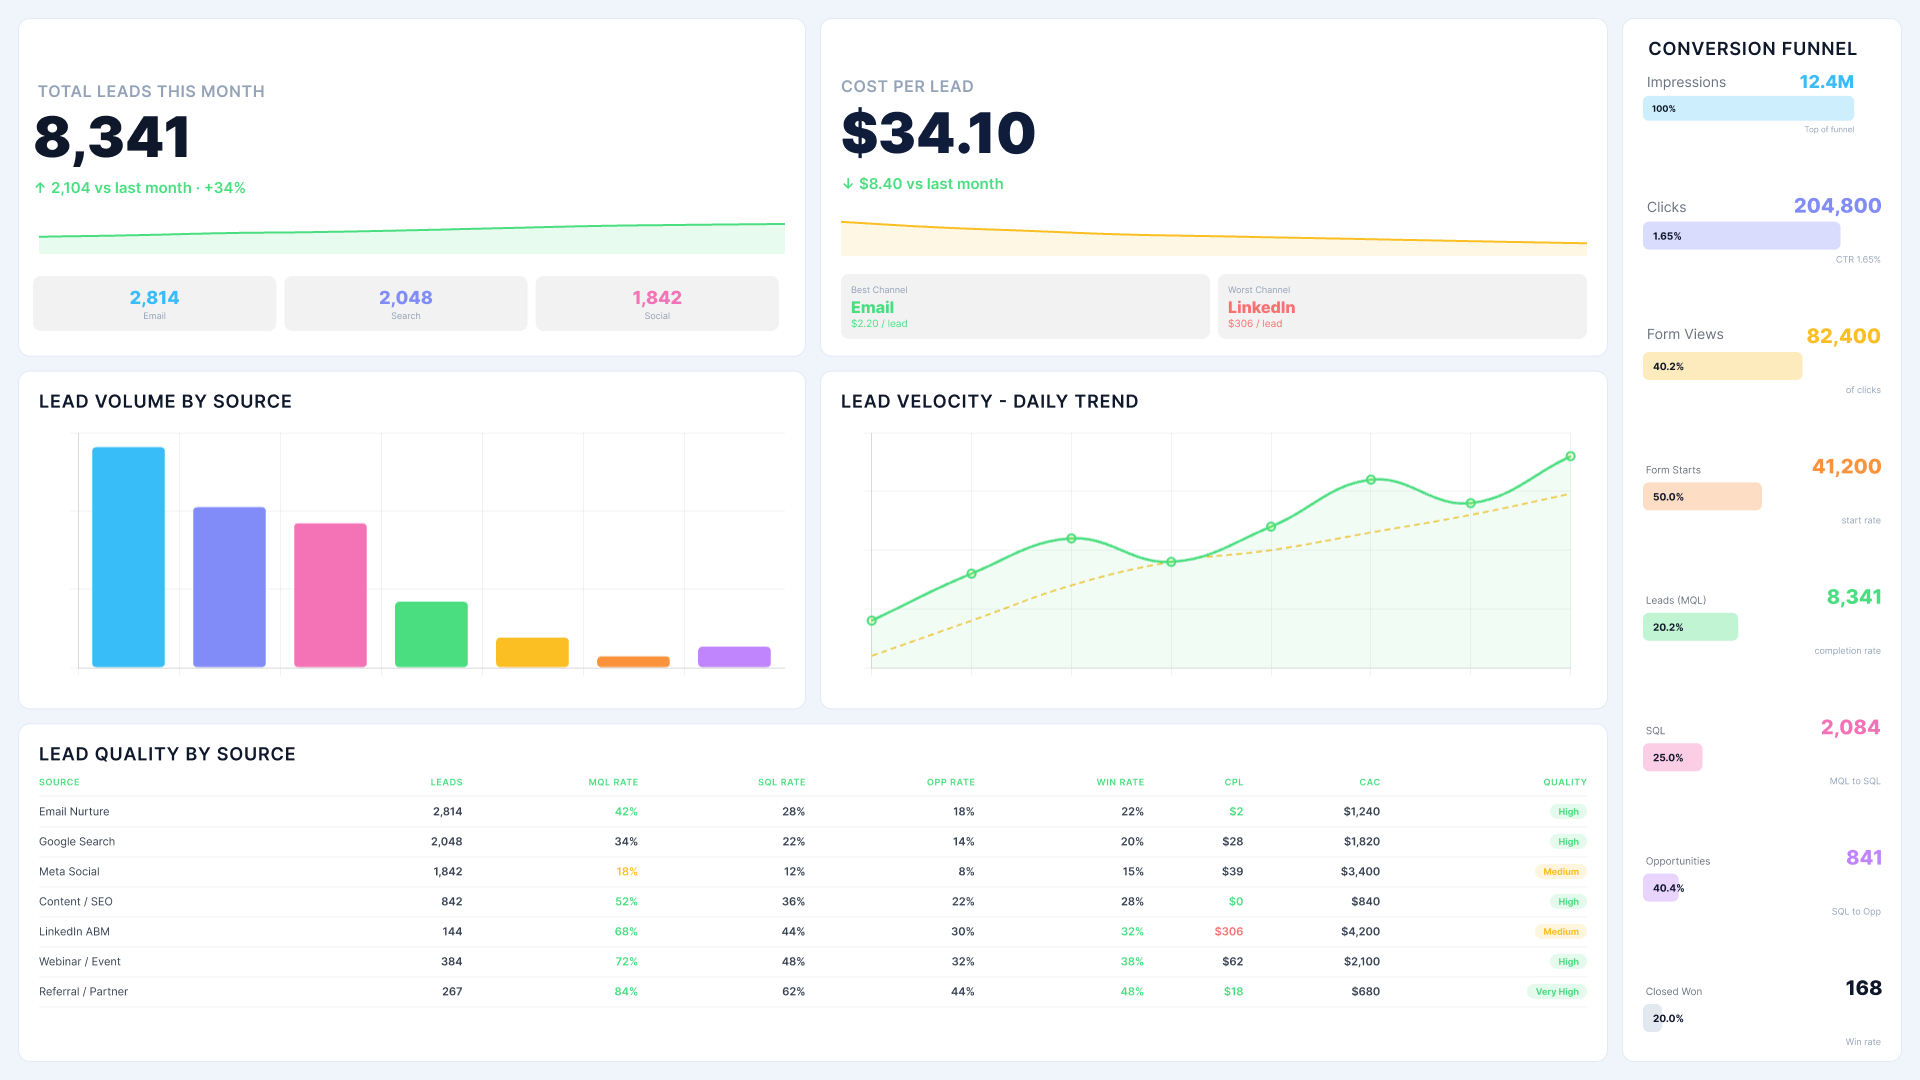
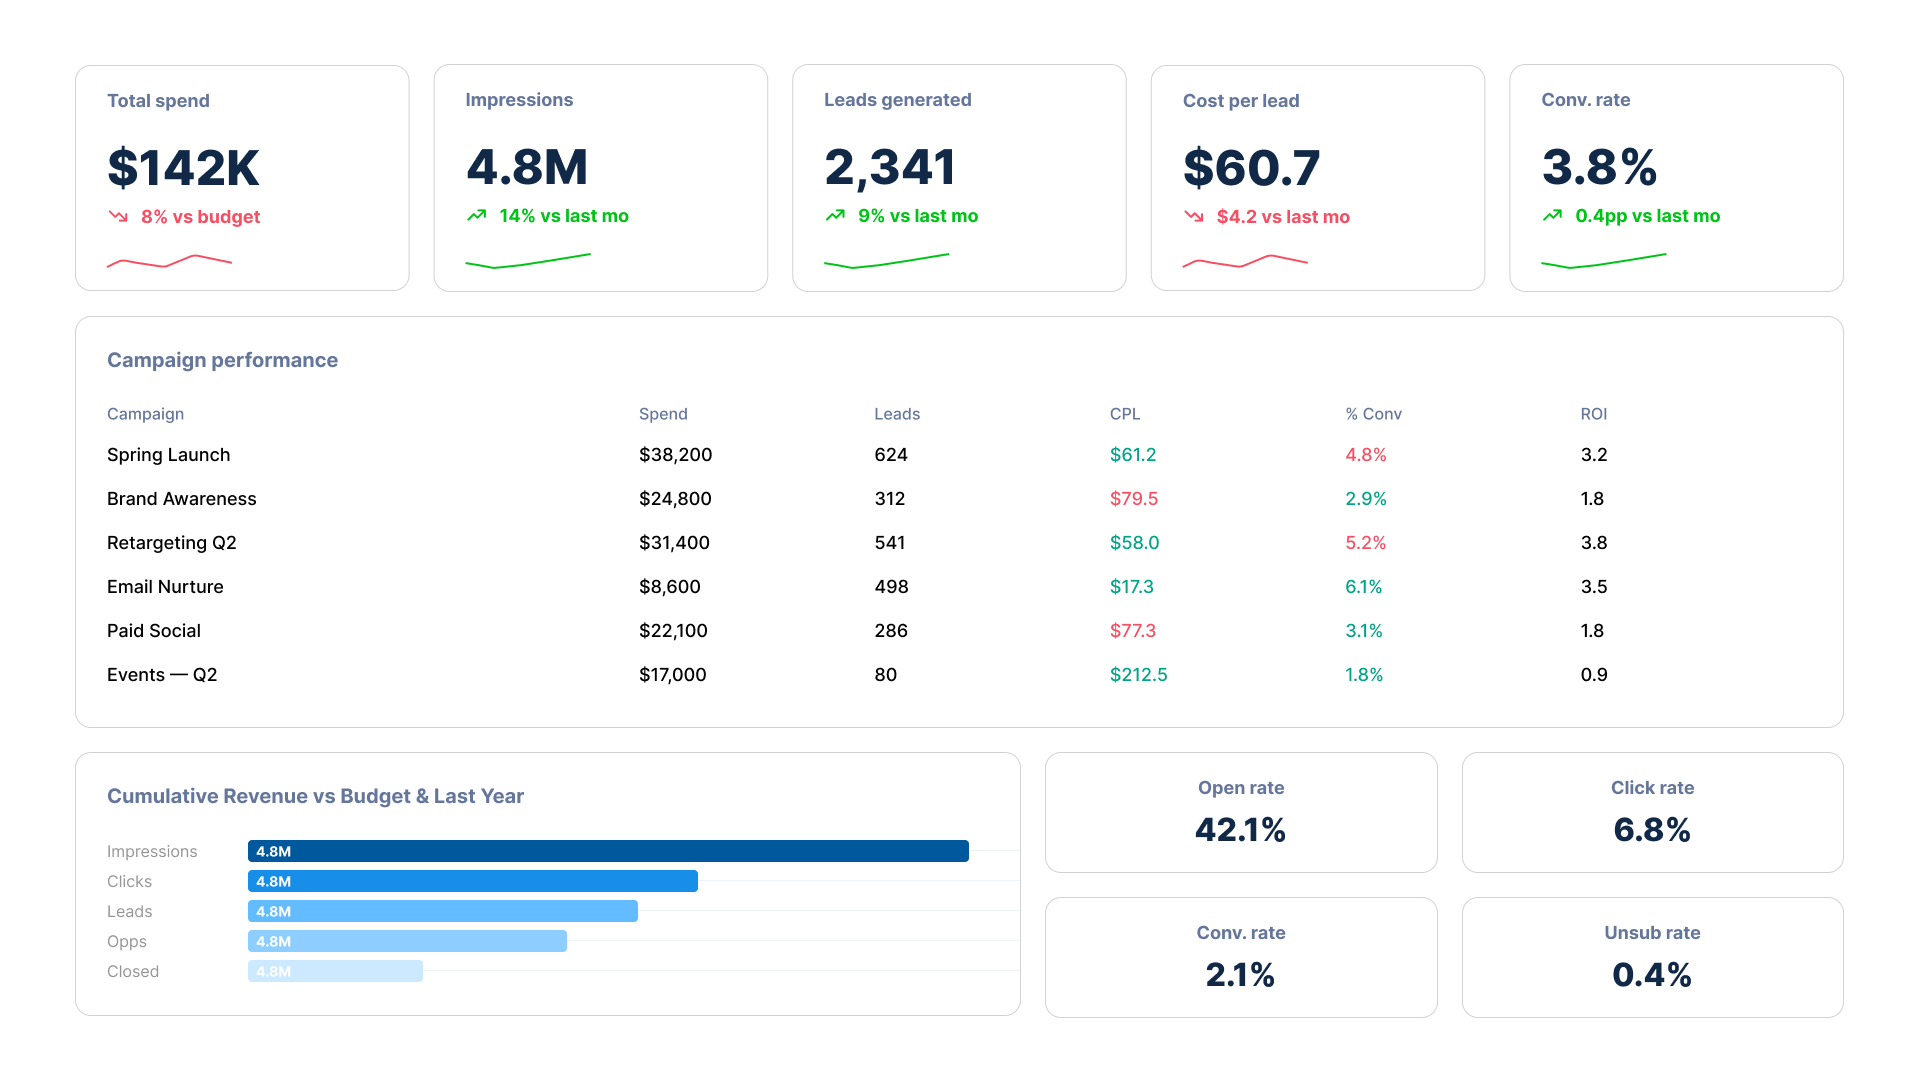
Power BI marketing analytics dashboard showing lead volume, cost per lead, and conversion funnel
See lead volume, lead source, and cost per lead across all campaigns and channels. Drill into specific campaigns to understand acquisition efficiency. Share with sales teams to align on lead quality and volume expectations.
Follow leads through the funnel and track conversion rates at every stage. Connect campaign activity to pipeline value so marketing can show its contribution to revenue in clear, defensible numbers.
Abstract background with a diagonal split between light blue and dark navy blue colors.

Email Campaign Dashboard

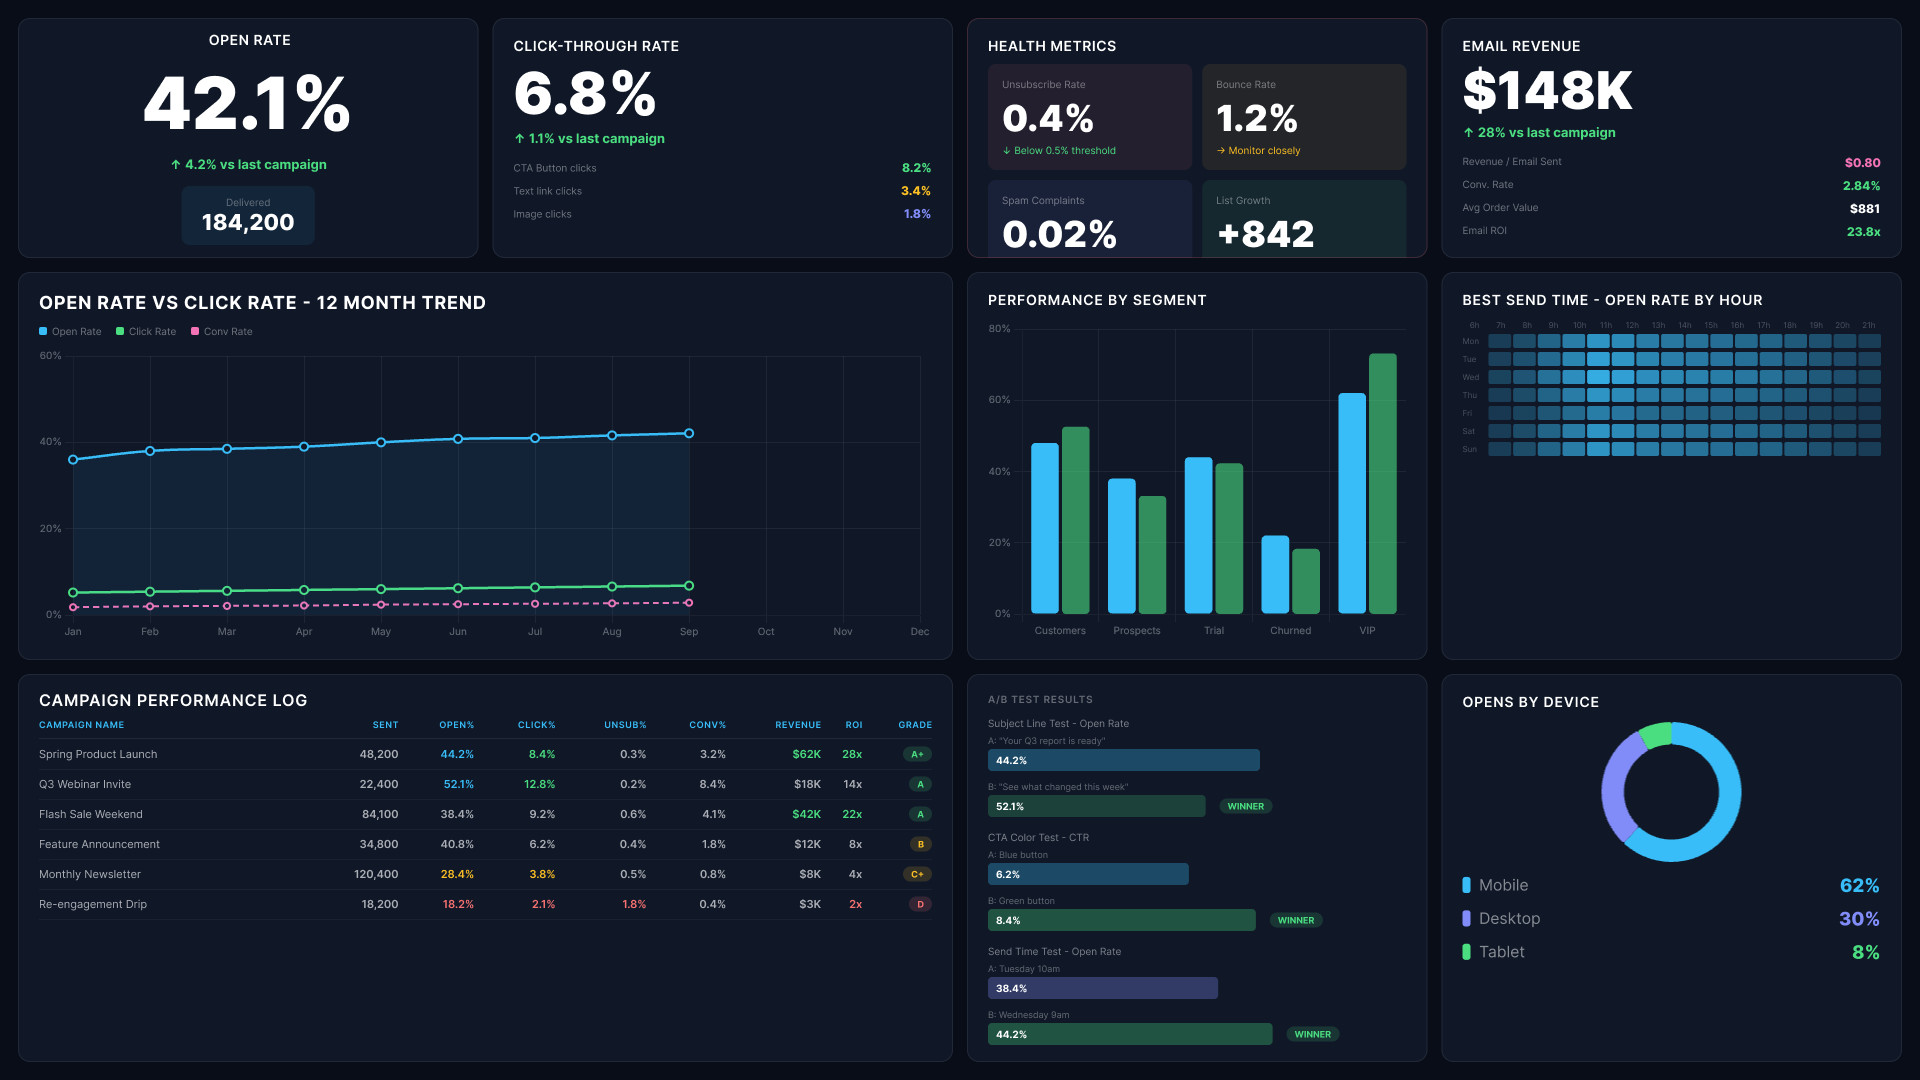
Power BI marketing analytics dashboard showing email open rates, click rates, and campaign performance log
Monitor open rates, click rates, unsubscribes, and conversions for every email campaign you run. Compare performance across campaigns and segments to understand what subject lines and content types are driving action.
View campaign performance week over week, month over month, or across quarters. Spot seasonal patterns, identify what worked in past campaigns, and use real data to plan the next one.

Social Media Campaign Dashboard

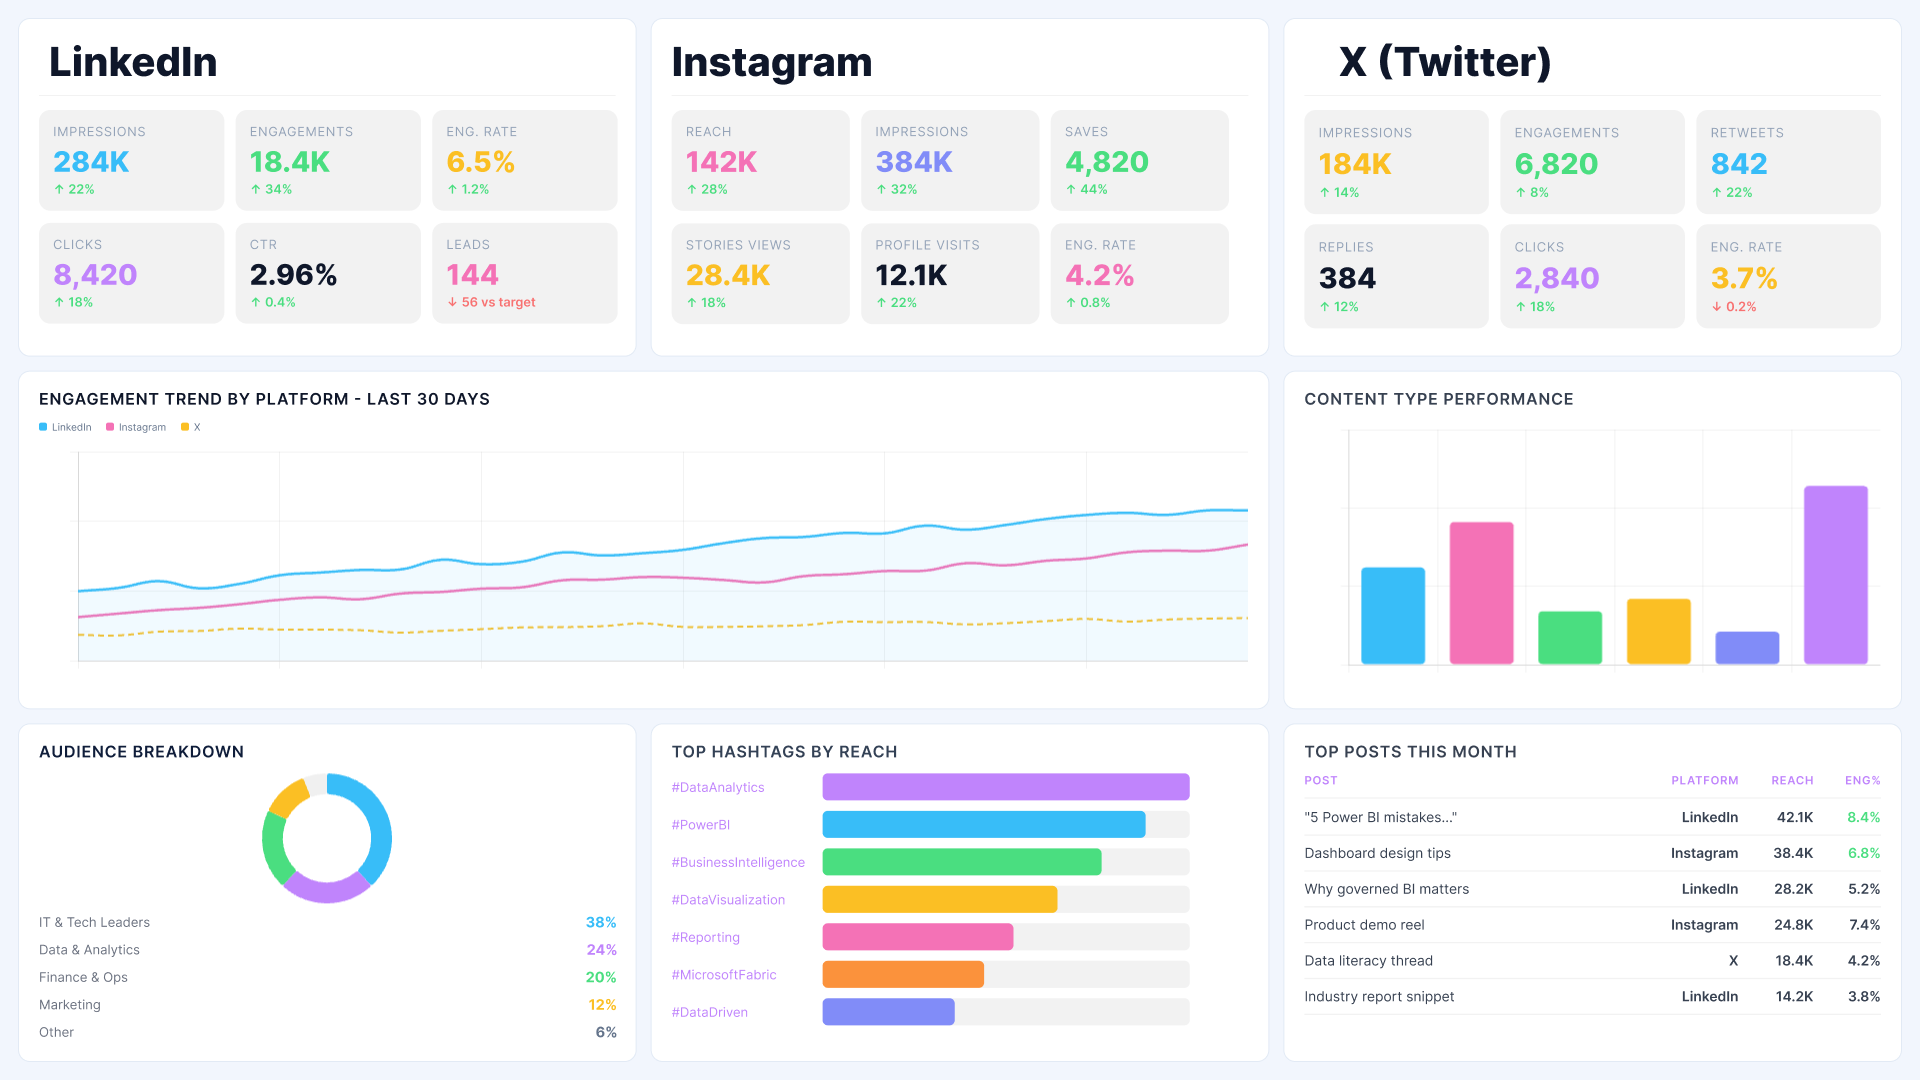
Power BI marketing analytics dashboard showing social media engagement across LinkedIn, Instagram and X
Track paid and organic social performance side by side. See reach, engagement, follower growth, and campaign-driven clicks across LinkedIn, Meta, and other channels. Understand which platforms are generating real business outcomes.
Compare performance across paid search, social, email, display, and events in one view. See which channels deliver the best return on investment and which are underperforming relative to spend.
Abstract background with a diagonal split between light blue and dark navy blue colors.

Campaign ROI and Attribution Dashboard
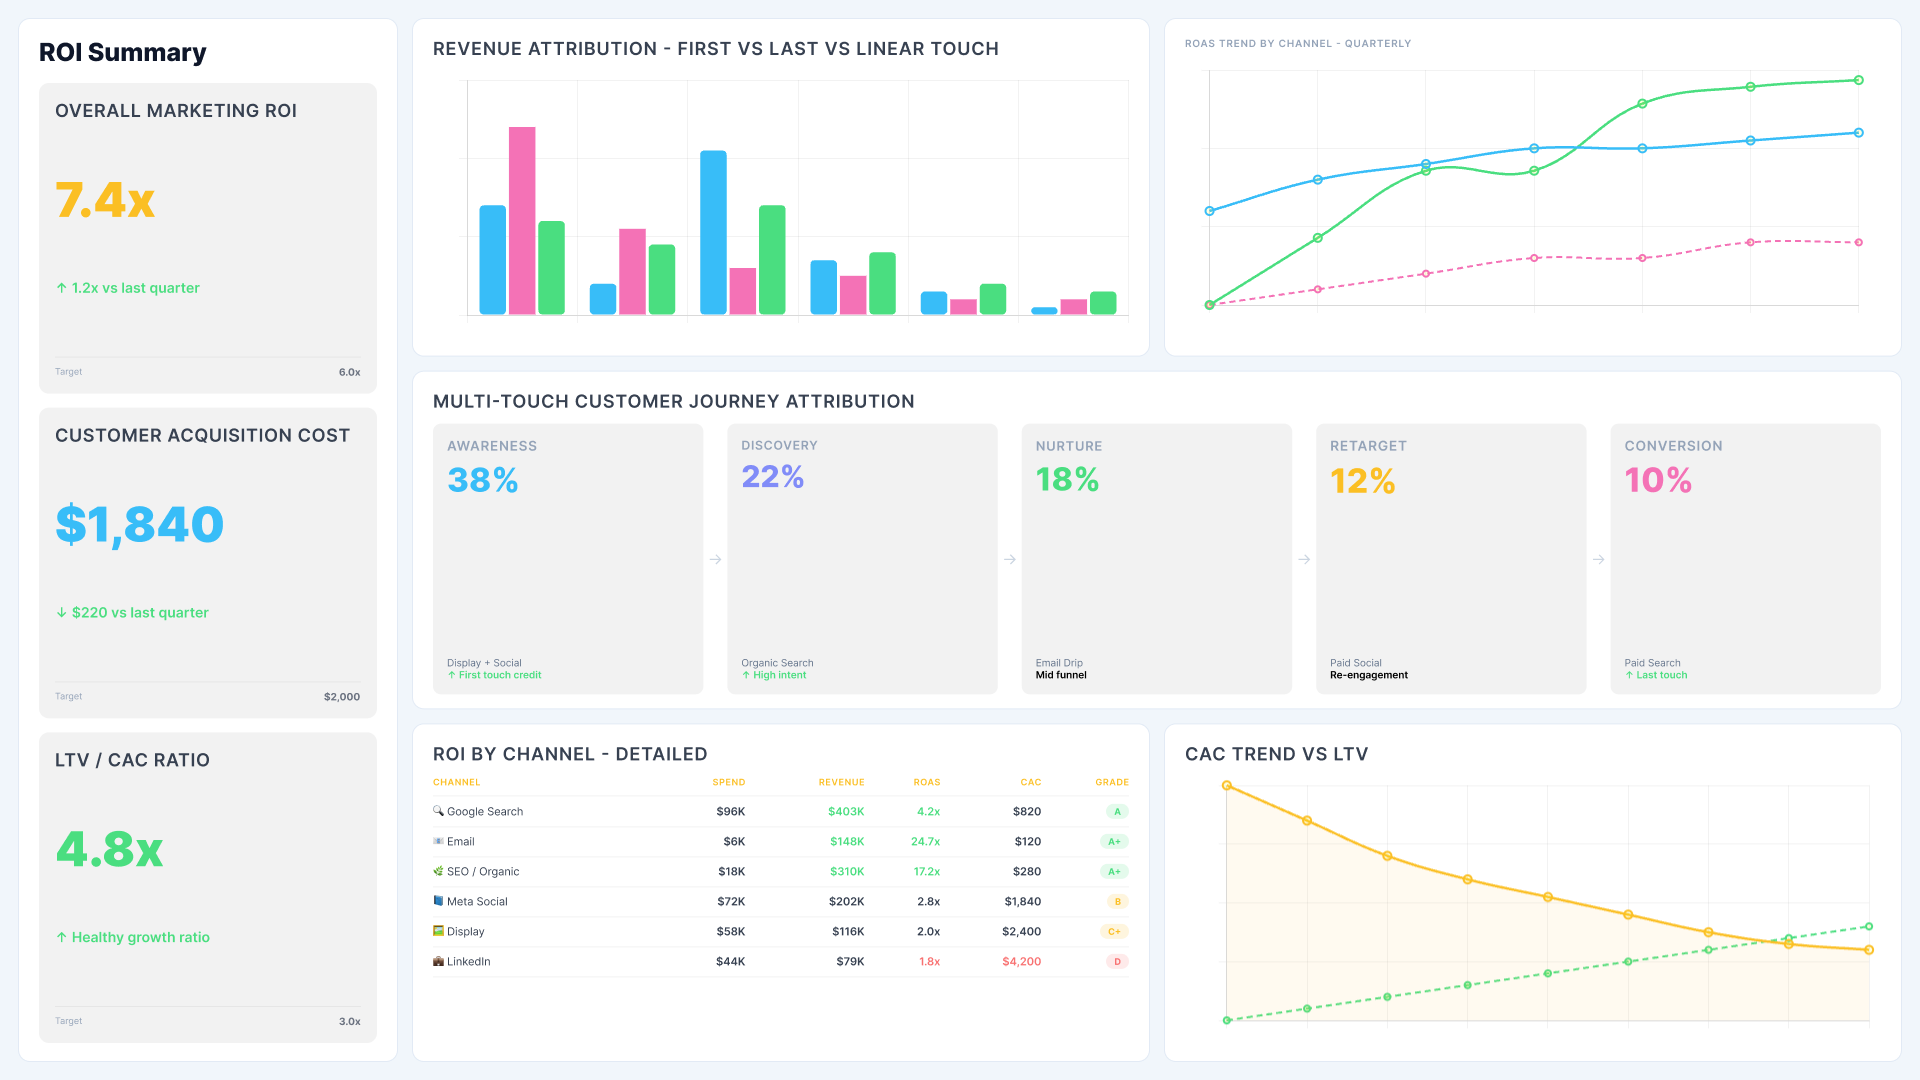
Power BI marketing analytics dashboard showing ROI attribution, customer acquisition cost and LTV analysis
Connect campaign activity to revenue by tracking pipeline contribution and closed deals back to their source campaign. This gives finance and leadership the ROI data they need to justify marketing investment.
Stop rebuilding reports every week and start making decisions on live data. Reporting Hub delivers ready-to-use Power BI marketing campaign dashboards that connect to your existing data sources and start delivering value within days.
GET STARTED WITH POWER BI MARKETING CAMPAIGN DASHBOARDS

Reporting Hub is a white-label BI platform built on Power BI

Your dashboards carry your brand, not ours. Deployment is fast. Reporting Hub works with what you already have and extends it into a governed, shareable intelligence layer your whole organisation can rely on.

Icon
Marketing Teams
See every campaign in one place. No more jumping between platforms to build a weekly update. Filters and drill-downs are built in so you can answer questions in the meeting, not after it.
Icon
Leadership and Finance
Get the ROI picture without submitting a report request. See spend, pipeline contribution, and revenue attribution in one summary. Drill down when a number needs context.
Icon
Sales Teams
Understand where leads are coming from and what campaigns are driving the best quality pipeline. Align with marketing on lead volume and conversion expectations using shared data.
Icon
External Clients and Agency Partners
Share campaign dashboards with clients or agency partners with permission-scoped access. Each external user sees only the data you choose to share with them.
Icon
No Data Migration Required
Reporting Hub connects directly to your existing Power BI data models and reports. The dashboard connects to any source your Power BI environment supports - paid ad platforms, CRM tools, email systems, and web analytics.
Icon
White-Label Ready
Your logo, colors, and domain replace ours completely. Clients interact with a dashboard that looks and feels like your product. Get a Free Trial

Frequently Asked Questions

Do I need to replace my existing Power BI setup to use this dashboard?

No. Reporting Hub connects directly to your existing Power BI data models and reports. There is no data migration required.

Can we share campaign dashboards with external clients or agency partners?

Yes, Reporting Hub is built for external delivery. Clients can access dashboards and see the data you share with them.

How quickly can we get the marketing campaign dashboard live?

Reporting Hub is designed for fast deployment without complex infrastructure work.

Can the dashboard be white-labeled to match our brand?

Yes, Reporting Hub is a white-label BI platform, so your logo, colors, and domain replace ours completely.

Which marketing platforms and data sources can the dashboard connect to?

The dashboard connects to any source your Power BI environment supports - paid ad platforms, CRM tools, email systems, and web analytics.