Power BI Risk Management Dashboard - One View of Enterprise Risk, Controls, and Compliance

Risk data rarely lives in one place. Your risk register is in one system, your control testing results are in another, compliance tracking is spread across spreadsheets, and incident logs sit in a separate tool. By the time anyone puts it all together, the picture is already out of date.

A Power BI risk management dashboard connects every source into one governed, real-time view. Risk owners, compliance teams, and leadership all work from the same numbers.

Smiling man with short dark hair wearing a dark shirt against a blue gradient background.
Brian DeLuca
11 min read . July 2025
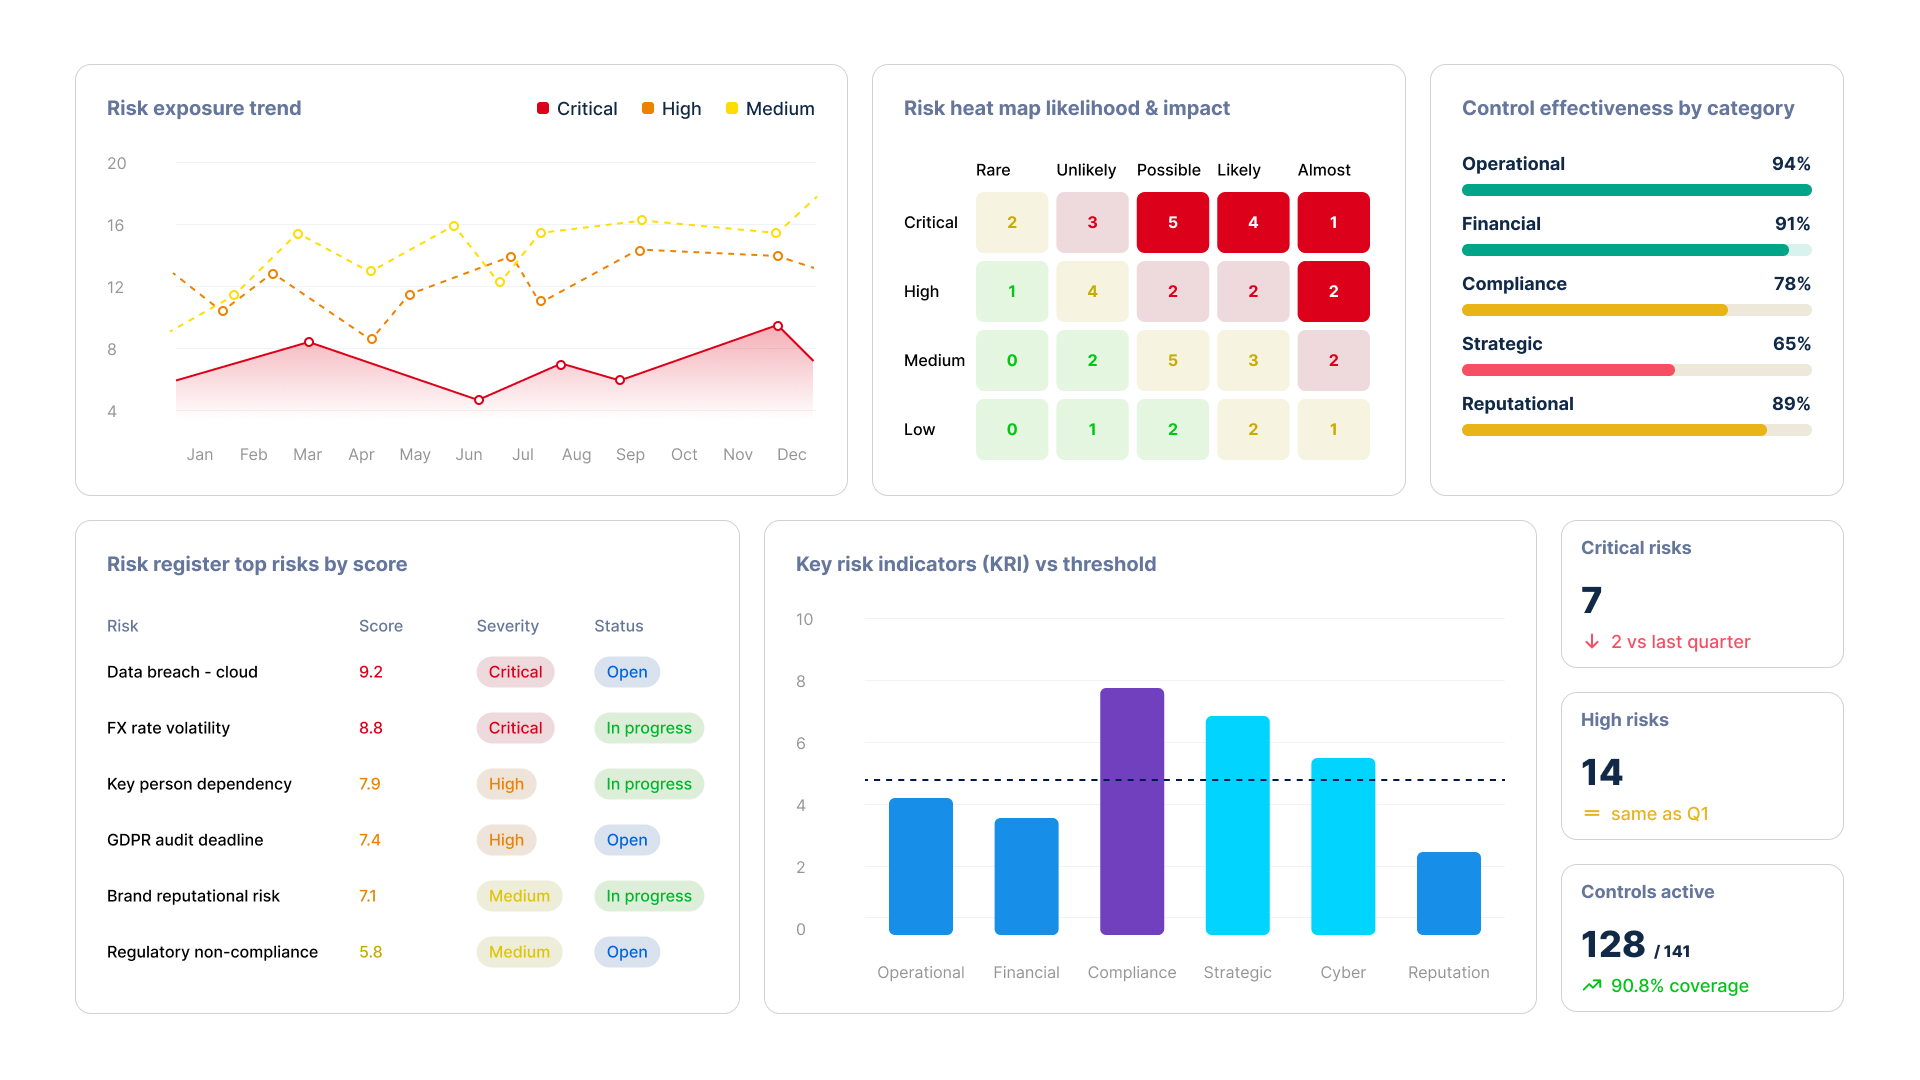
Power BI risk management dashboard showing risk exposure trend, risk heat map, KRI vs threshold and control effectiveness
THE RISK DATA PROBLEM MOST ORGANISATIONS FACE

Risk is not invisible. It is just scattered across systems that do not talk to each other.

Most organisations have the data they need to manage risk well. The problem is that it lives in too many places, in too many formats, and arrives too late for anyone to act on it while it still matters. A Power BI risk management dashboard changes that by connecting every source into one consistent, governed view.

Icon
Risk Register and Exposure
A live risk register that tracks every open risk by category, severity, owner, and status. Exposure trends are visible over time. The board sees the risks that matter most without needing to request a separate report.
Icon
Control Effectiveness
See which controls are working and which are weak or failing. Track testing results by domain. Identify the gaps most likely to result in a breach, an audit finding, or a regulatory penalty before they do.
Icon
Compliance Monitoring
Track compliance status across every framework your organisation operates under. ISO 27001, GDPR, SOC 2, PCI DSS. See where you stand, what is in progress, and what is at risk of falling short before the next audit cycle begins.
Icon
Key Risk Indicators
Monitor the metrics that signal rising risk before it becomes an incident. Failed login attempts, patch compliance rates, open vulnerabilities, third-party scores. Breaches against thresholds trigger alerts automatically so the right person is notified while action is still possible.
Icon
Incident Tracking
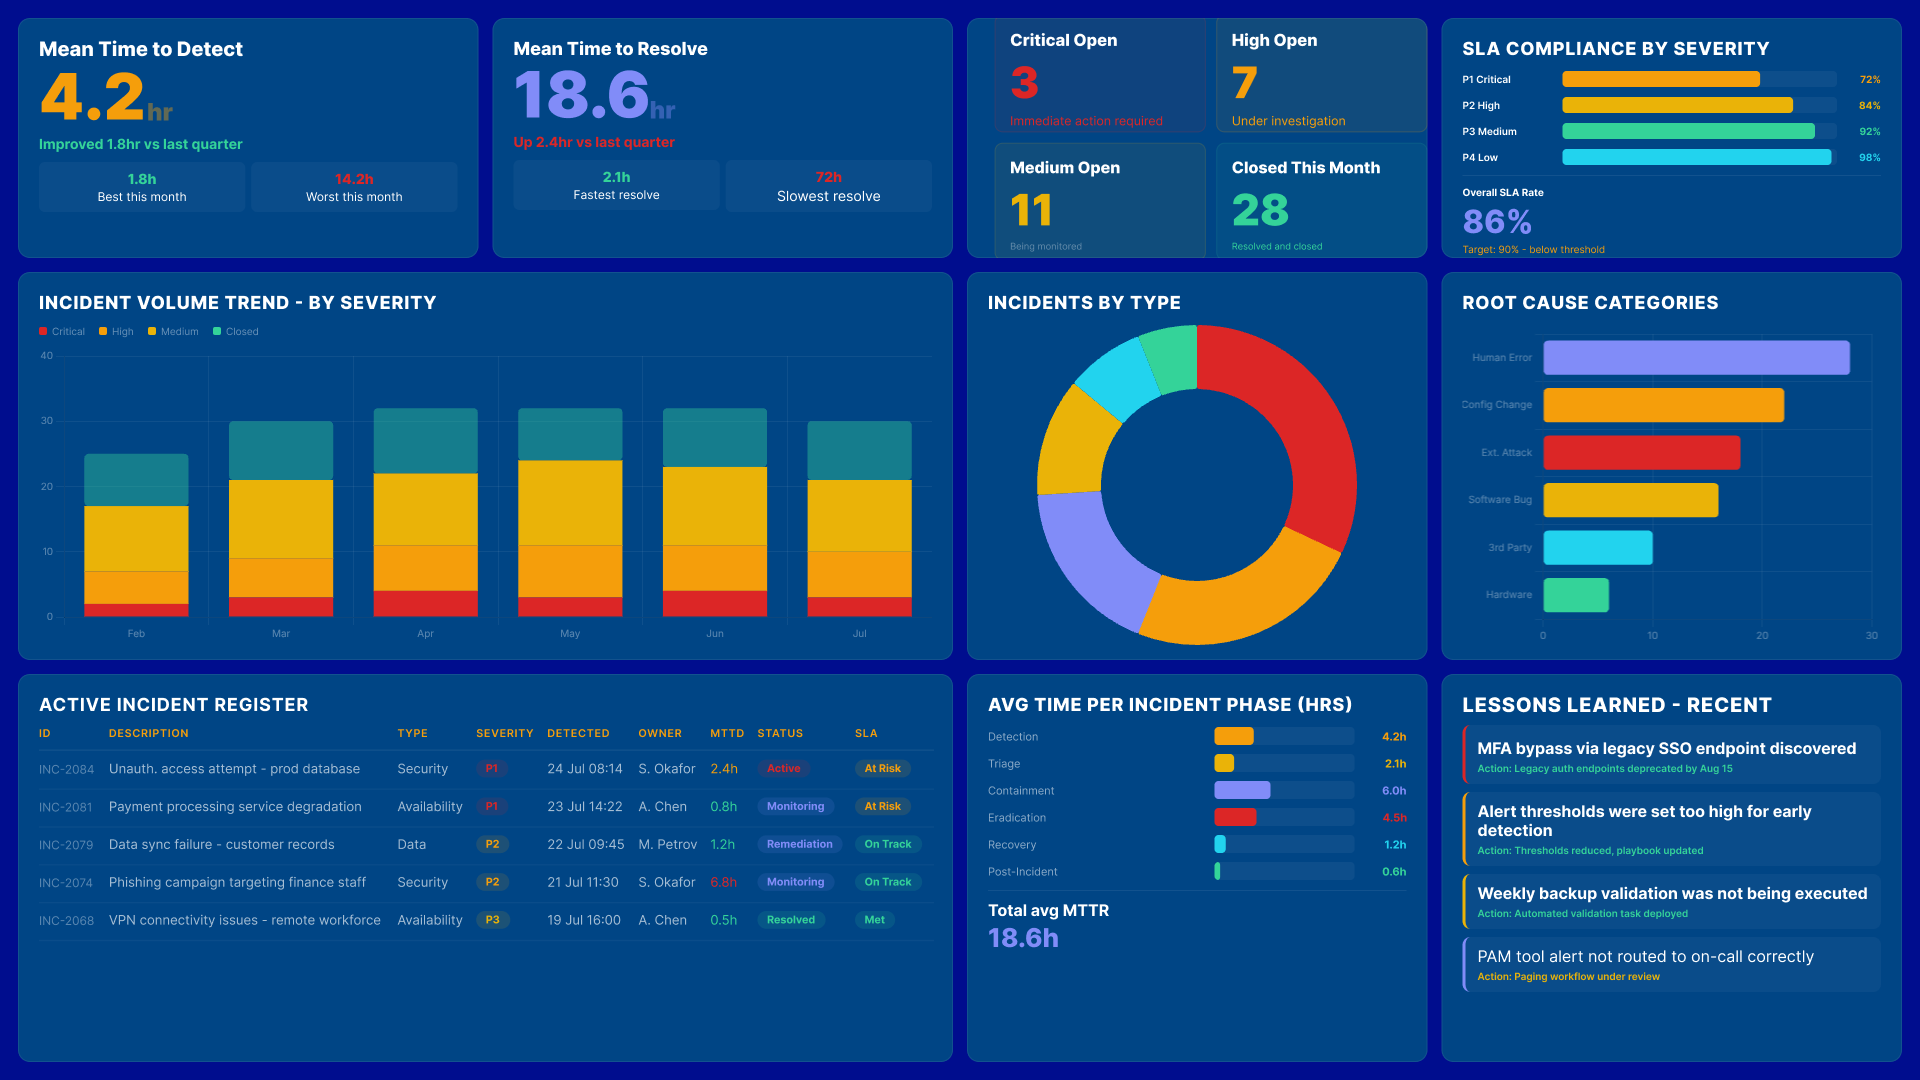
Track every incident from detection through resolution. Monitor mean time to detect, mean time to resolve, SLA compliance by severity, and root cause patterns. Lessons learned are captured and visible rather than buried in a post-incident report nobody reads.
Icon
Board and Executive Reporting
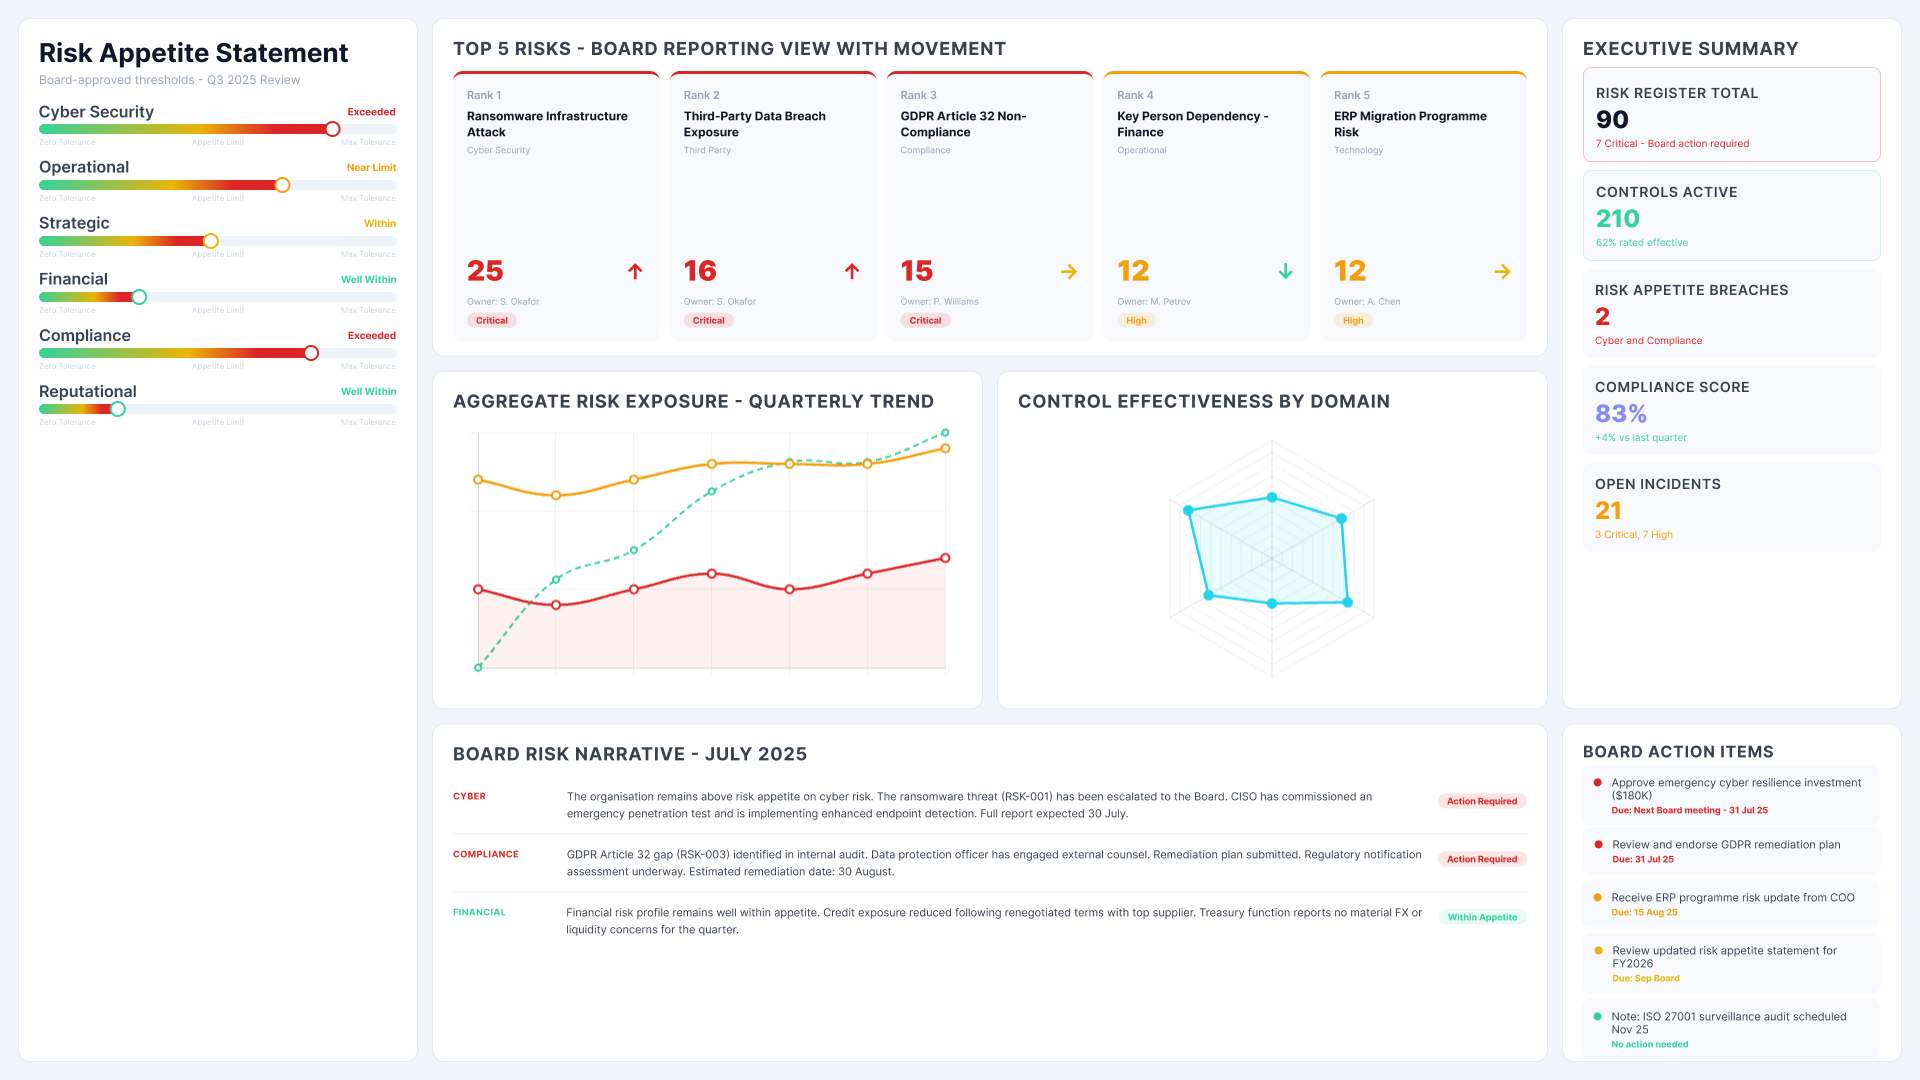
Risk appetite statements, top risk rankings, aggregate exposure trends, and compliance scores in one board-ready view. Leadership sees what they need without a manual pack being assembled the day before the meeting.

What Power BI Risk Management Dashboards Cover

Each dashboard focuses on a specific risk decision area. Together they give risk, compliance, and leadership teams a consistent, always-current picture of enterprise risk exposure.

Risk Register Dashboard
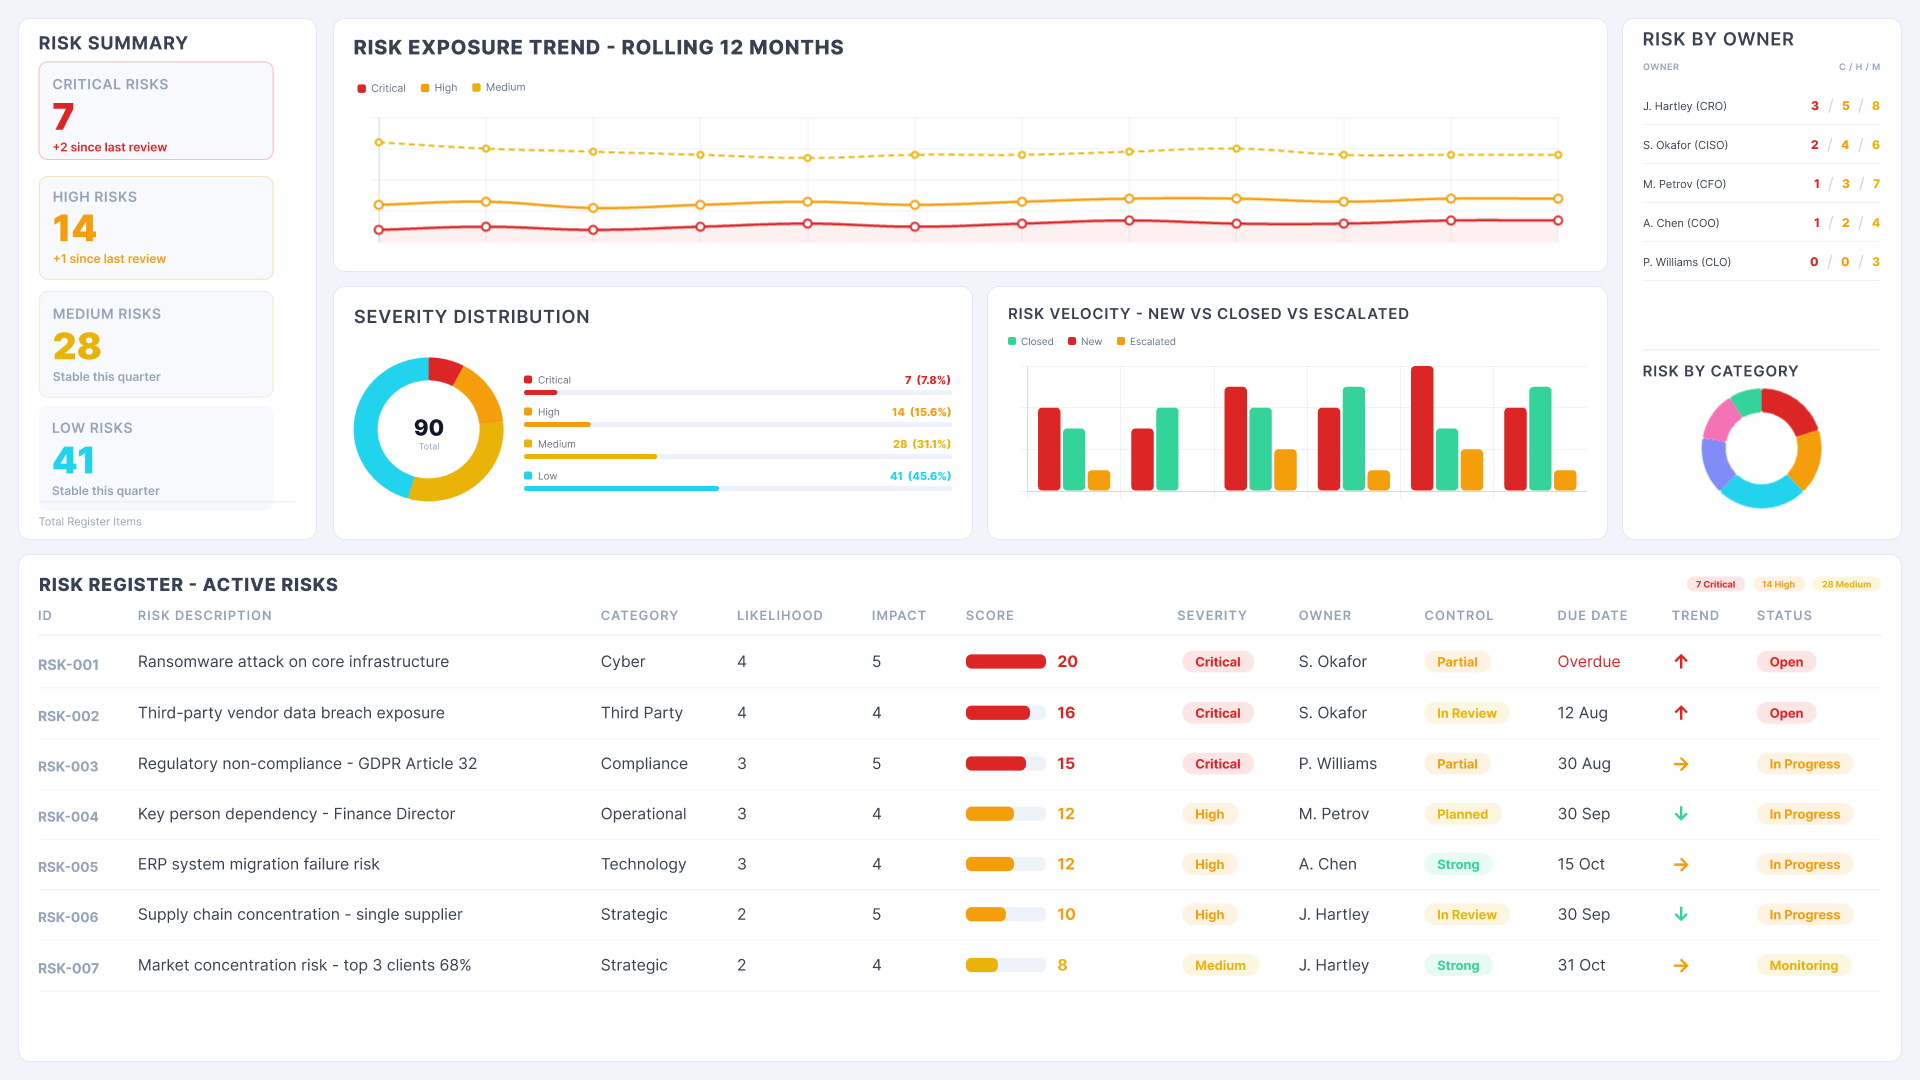
Power BI risk management dashboard showing risk register with severity distribution, exposure trend and risk by owner
Maintain a live register of every active risk with full detail on category, likelihood, impact, owner, control status, and remediation timeline. Exposure is tracked over rolling periods so trends are visible before they compound into something larger.
Abstract background with a diagonal split between light blue and dark navy blue colors.

Risk Heatmap Dashboard

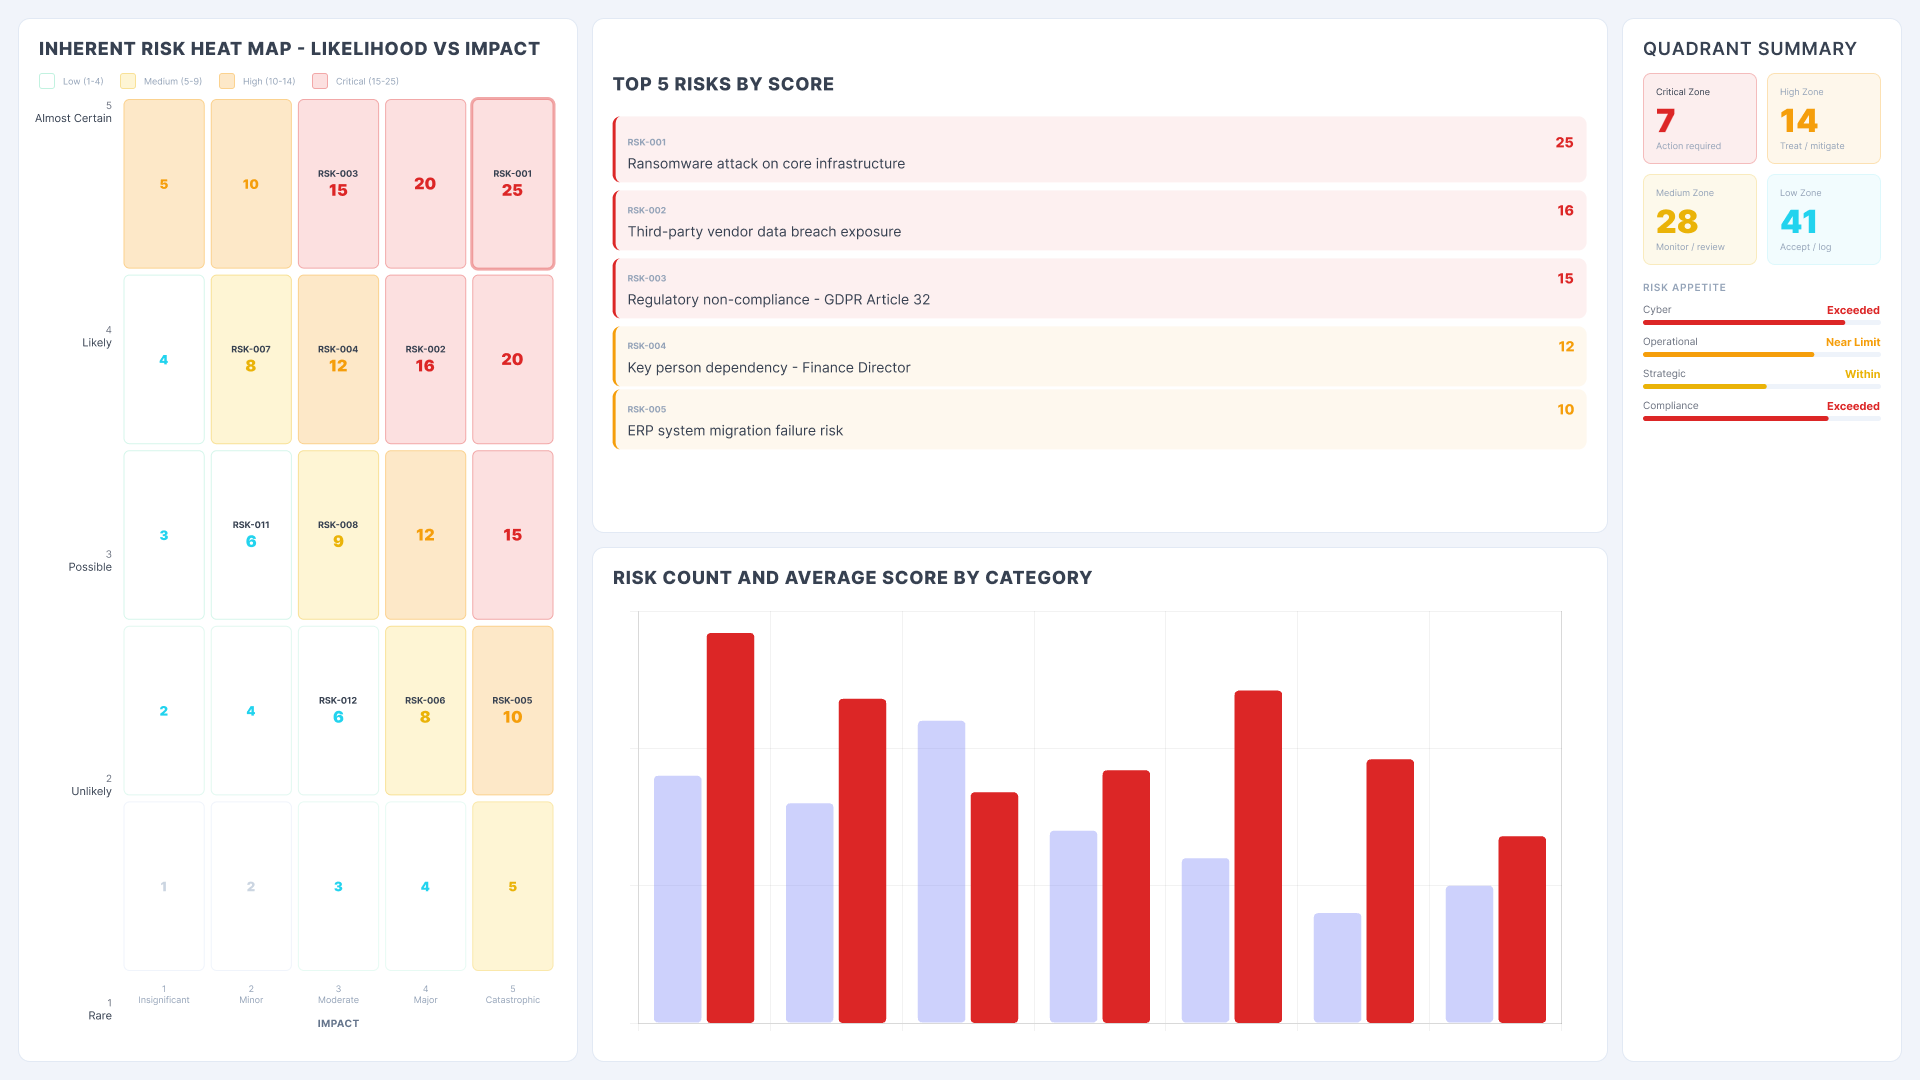
Power BI risk management dashboard showing inherent risk heat map by likelihood and impact with top 5 risks by score
Visualise risk concentration by likelihood and impact in a single interactive heatmap. Identify which quadrants are most populated. See which risks sit above the risk appetite threshold and require immediate action versus those that can be monitored and logged.

Key Risk Indicators Dashboard

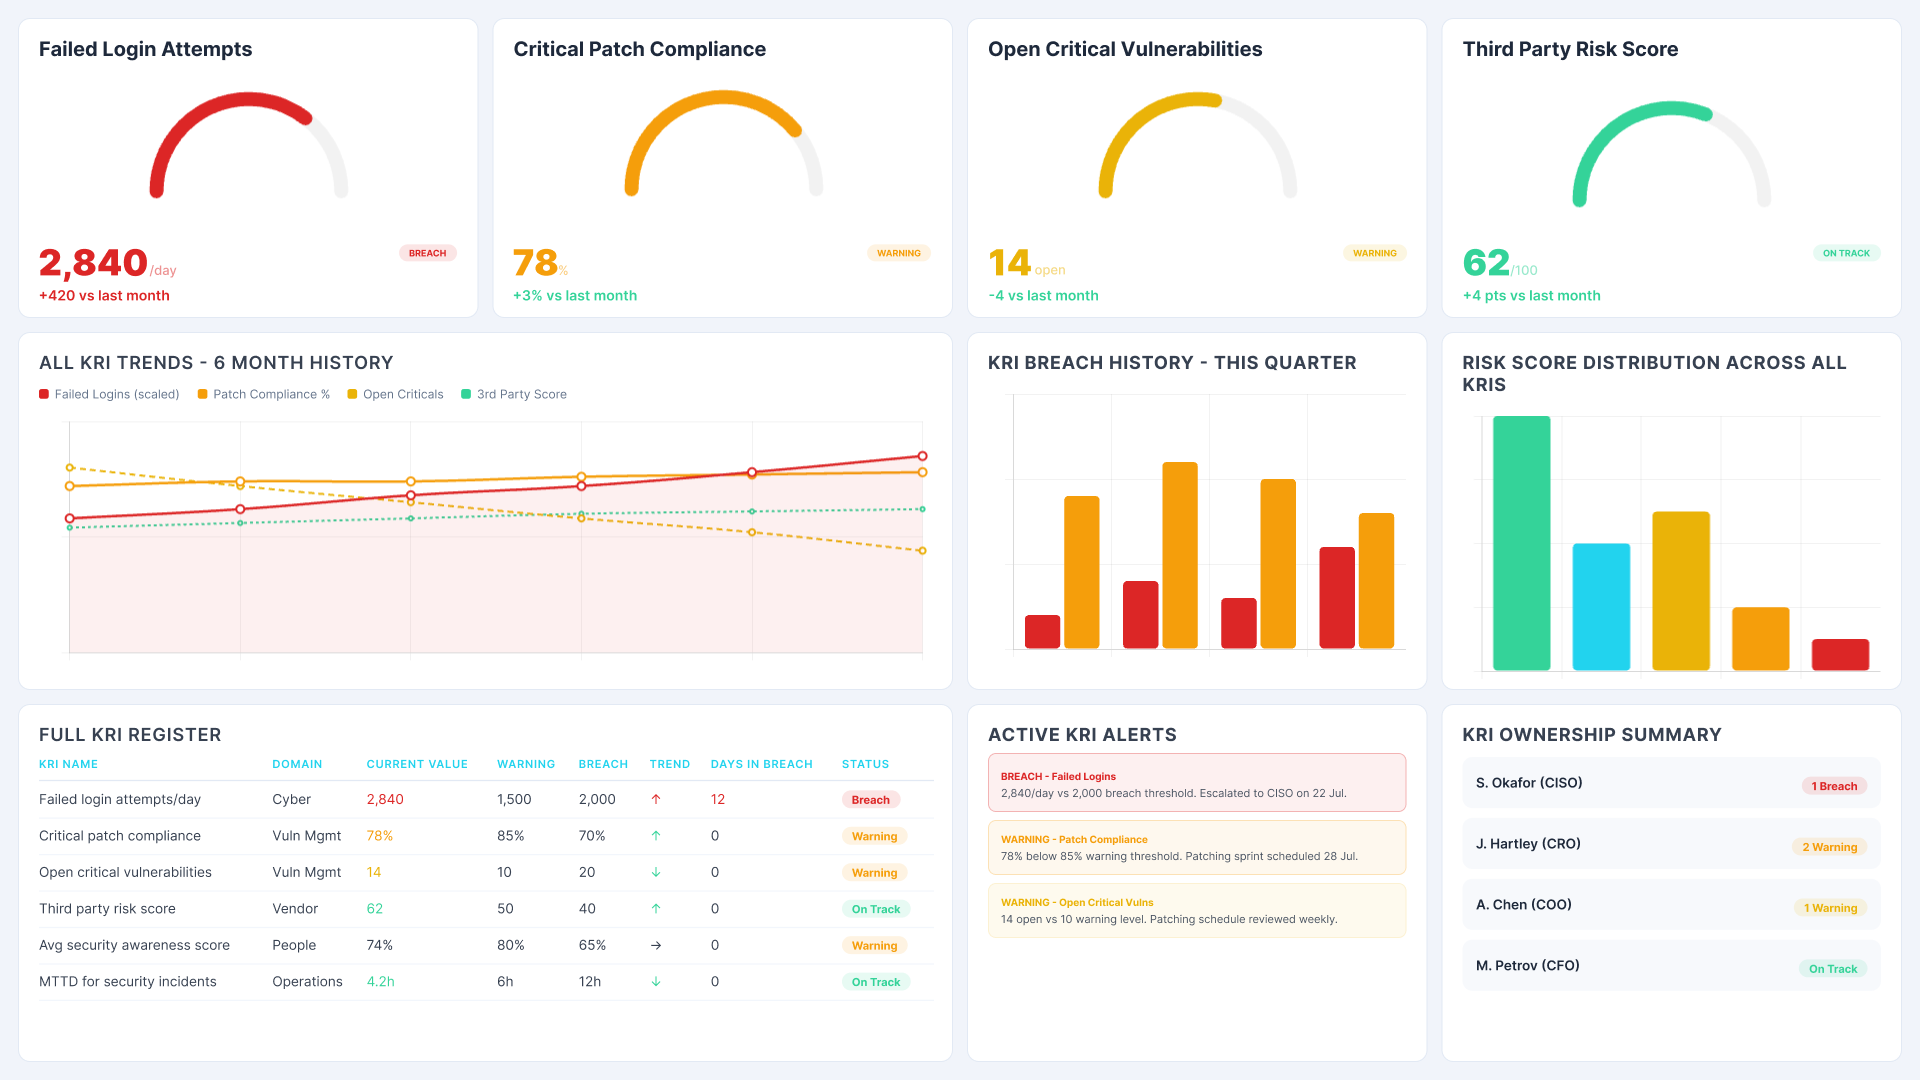
Power BI risk management dashboard showing KRI trends, breach history, full KRI register and active KRI alerts
Track the metrics that signal rising risk before it becomes a problem. Monitor each KRI against its warning and breach thresholds in real time. Automated alerts notify the right owner when a threshold is crossed so the organisation can respond while the risk is still manageable.
Abstract background with a diagonal split between light blue and dark navy blue colors.

Control Effectiveness Dashboard

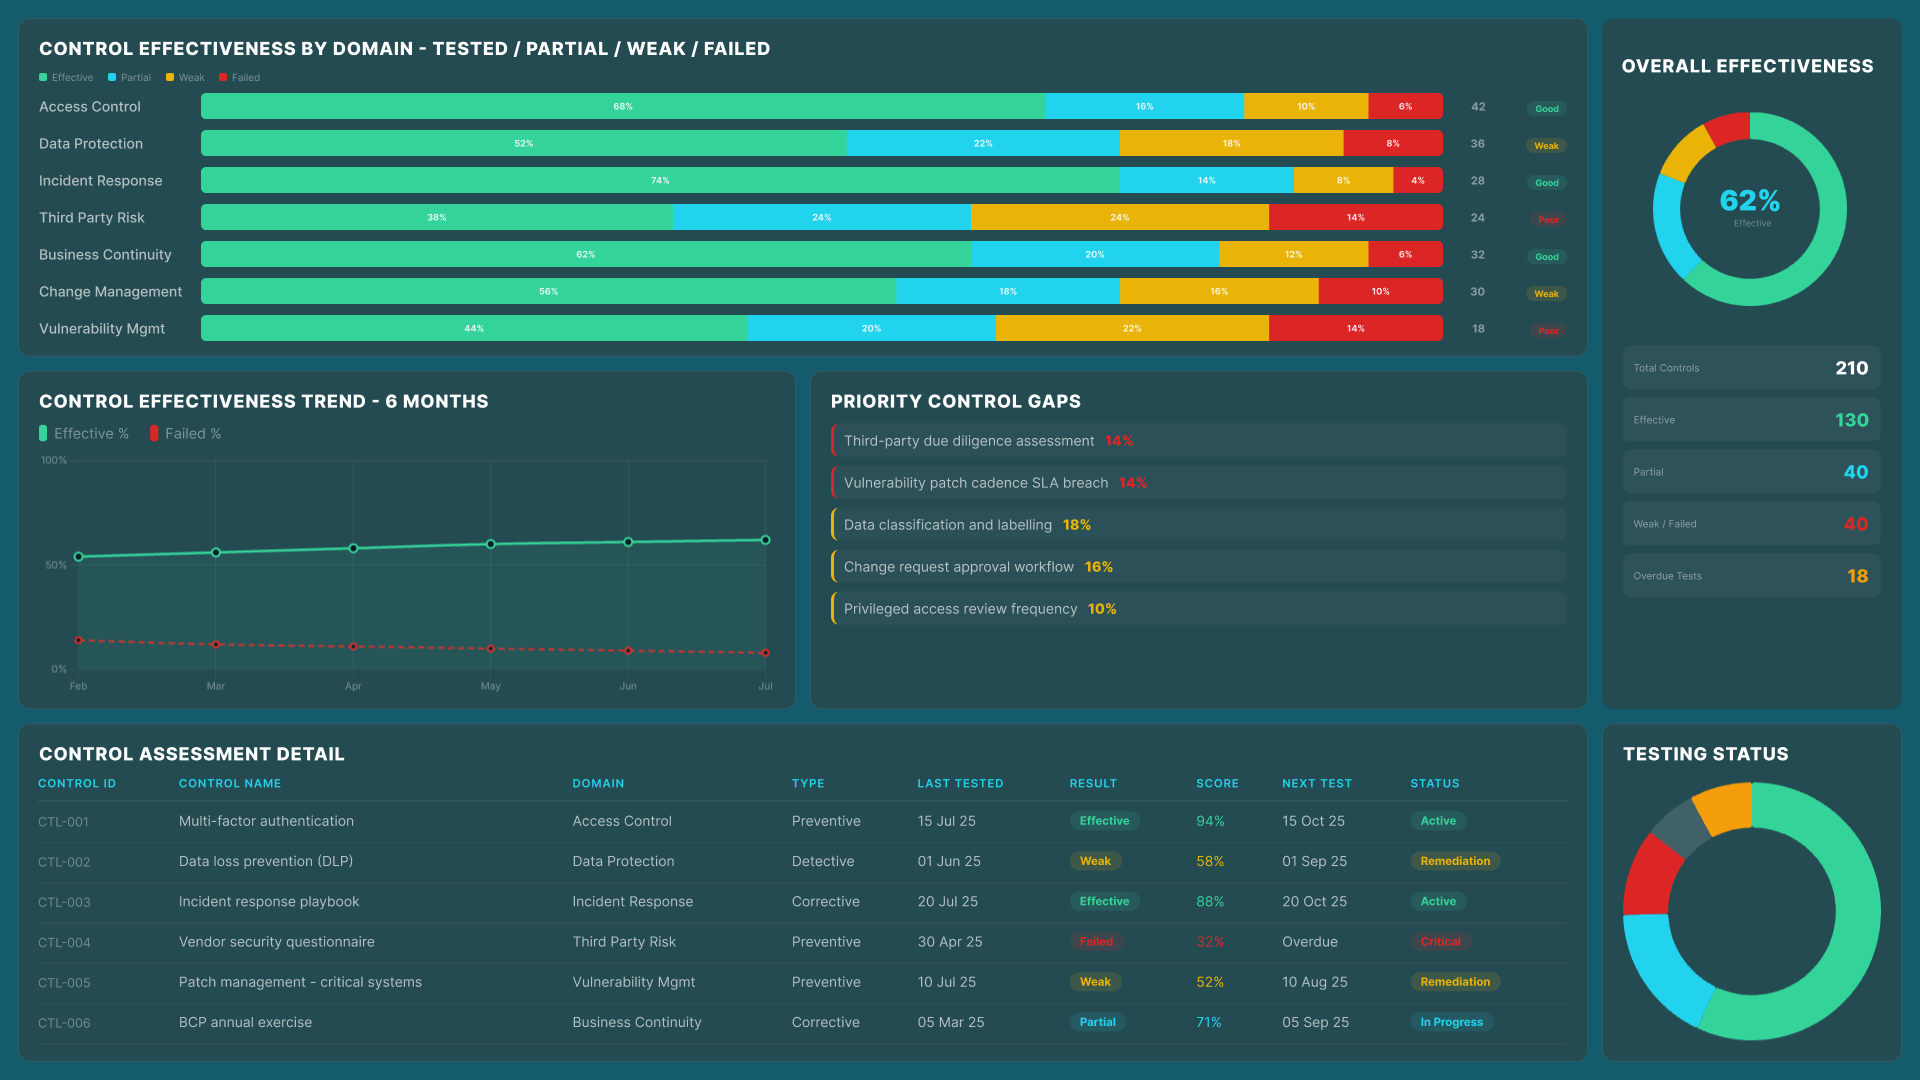
Power BI risk management dashboard showing control effectiveness by domain, priority control gaps and control assessment detail
See which controls are rated effective, partial, weak, or failed across every domain. Track testing results over time. Identify the gaps most likely to result in an audit finding or a control failure and prioritise remediation before the next testing cycle.

Compliance Monitoring Dashboard

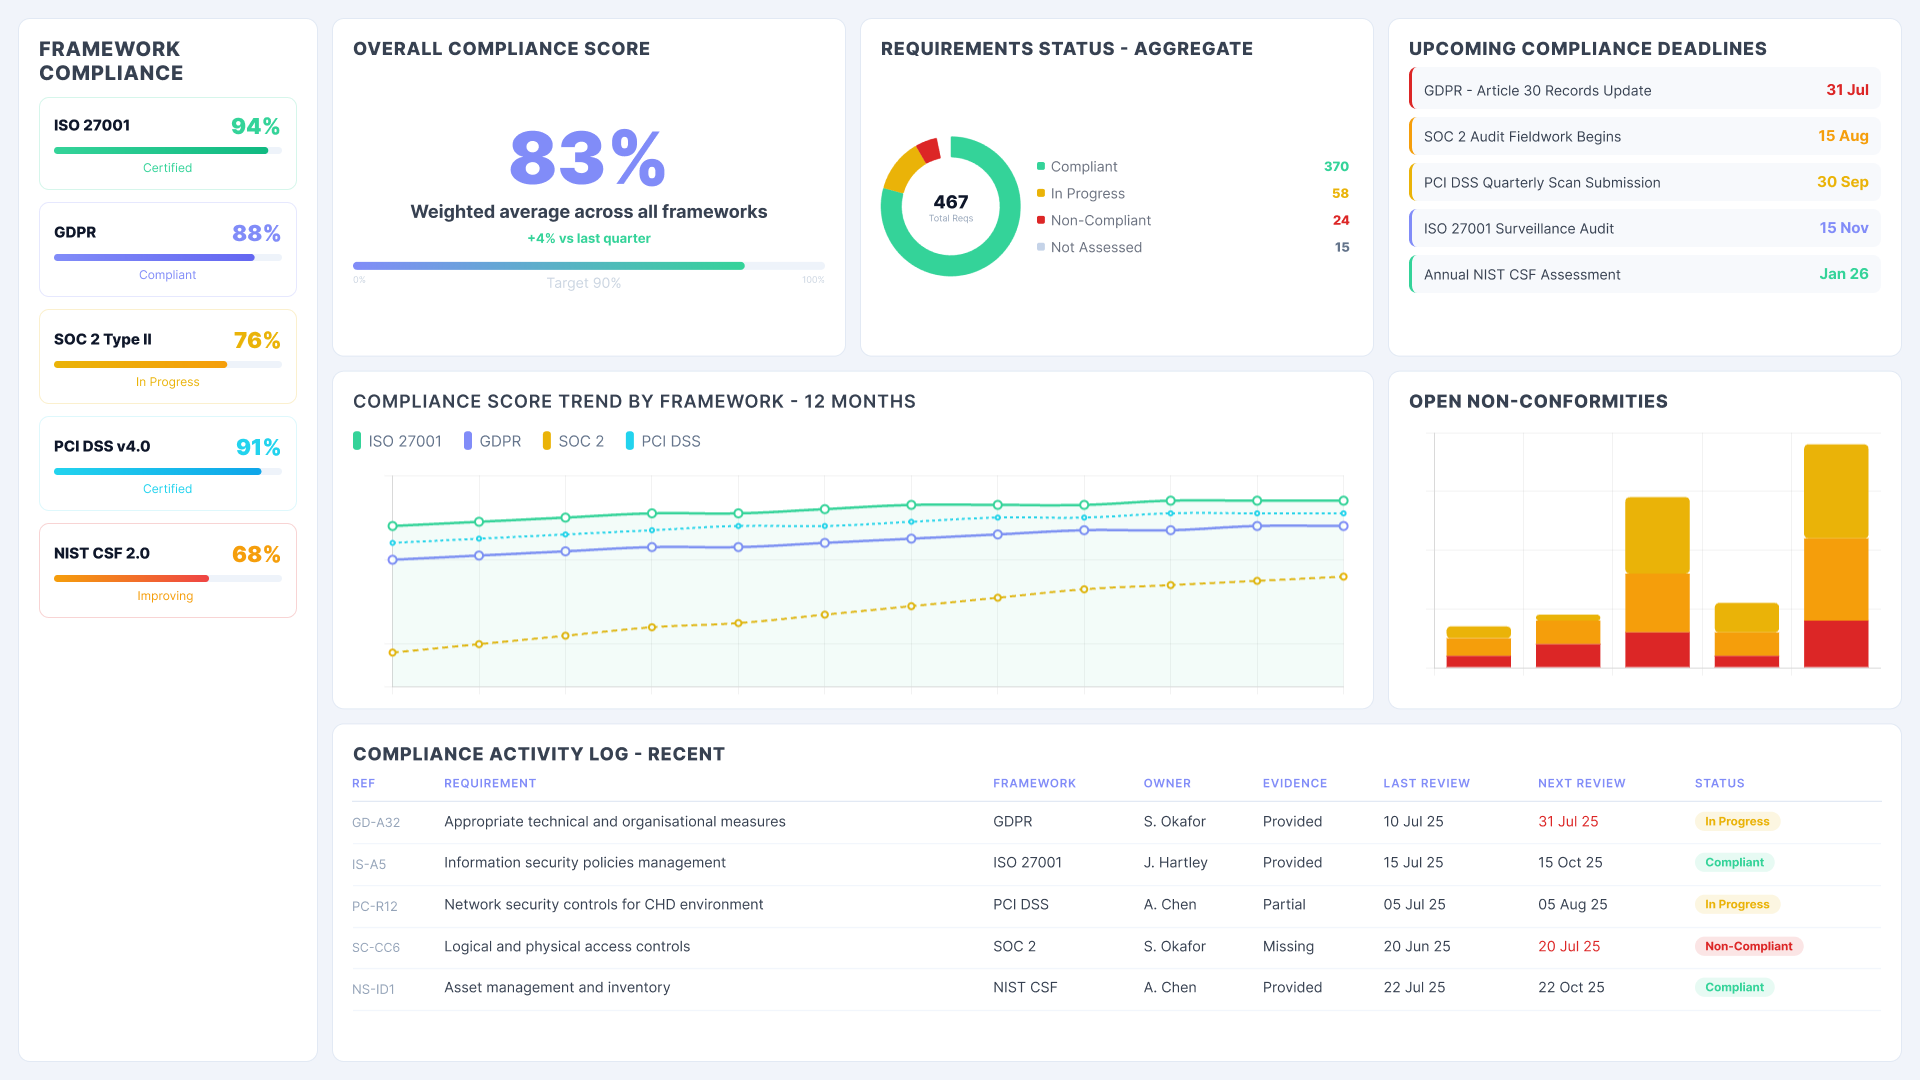
Power BI risk management dashboard showing framework compliance scores, compliance score trend and upcoming compliance deadlines
Monitor compliance status across every regulatory framework your organisation operates under. See overall scores, requirement status, upcoming deadlines, and non-conformities in one view. The compliance picture is always current, not rebuilt the week before an audit.
Abstract background with a diagonal split between light blue and dark navy blue colors.

Incident Tracking Dashboard

Power BI risk management dashboard showing incident volume by severity, mean time to detect, incidents by type and active incident register
Track every incident from detection to resolution in real time. Monitor mean time to detect and resolve, SLA compliance by severity level, and root cause categories. Spot patterns in incident type and frequency before they indicate a systemic control failure.

Board Risk Reporting Dashboard

Power BI risk management dashboard showing board risk appetite statement, top 5 risks, aggregate exposure trend and board action items
Deliver a structured risk summary directly to the board. Risk appetite status, top risks by score, aggregate exposure trends, and open action items in one governed view. Board packs stop being assembled manually the day before a meeting.
WHO USES A RISK MANAGEMENT DASHBOARD AND WHAT THEY NEED FROM IT

Risk data is not just for the risk team. Every stakeholder has a different view of the same exposure.

Reporting Hub is built on your existing Power BI environment. No new platform to adopt, no migration to complete, no parallel system to maintain. It connects your existing risk, compliance, and operational data sources into a governed, scalable dashboard environment that every team can use from day one.

Icon
Risk and Compliance Teams
The day-to-day owners of risk. They need a live view of every open item, its status, its owner, and its trajectory. The dashboard replaces manual status tracking and gives the team more time to act on risk rather than report on it.
Icon
Legal and Regulatory Affairs
Legal teams need visibility into compliance obligations and their current status without submitting requests to a separate team. The dashboard gives them a clear, always-current view of where the organisation stands against each regulatory requirement.
Icon
Internal Audit
Internal auditors need a reliable, consistent record of controls, testing results, and remediation activity. The dashboard provides that view without requiring anyone to assemble data from multiple sources ahead of an audit engagement.
Icon
CISO and Security Teams
Security leaders need KRI data, incident patterns, and control effectiveness in one place. They need to see what is breaching thresholds today and what the trend looks like over the past quarter. The dashboard provides both without requiring a separate reporting workflow.
Icon
Executive Leadership and Board
Executives and board members need a structured summary of risk appetite, top risks, and aggregate exposure without a manual pack being assembled before every meeting. The dashboard provides that view on demand and keeps it current between reporting cycles.
Icon
No New Infrastructure Required
Reporting Hub connects to your existing risk systems, GRC tools, and Power BI models. Setup is fast. The governance layer is built in, not bolted on. Get a Free Trial

Risk Management Dashboard FAQs

Can the dashboard connect to our existing GRC or risk management system?

Yes. It connects to any source your Power BI environment supports, including GRC platforms, spreadsheets, and operational systems.

How is sensitive risk data kept secure when shared with the board or external auditors?

Row-level security ensures each user only sees the data they are permitted to access. Sensitive risk detail stays protected at all times.

Can different teams see different views of the same risk data?

Yes. Views are configured per audience. The board sees the summary. Risk teams see the full detail. Each view is governed independently.

Can we set alerts when a KRI breaches a threshold?

Yes. Alerts are configurable for any KRI metric. The right owner is notified automatically when a warning or breach threshold is crossed.

Does it work across multiple business units or regulatory jurisdictions?

Yes. Data is connected across units and jurisdictions with filters scoped to each team's remit and access permissions.

How long does implementation take?

Most organisations access live risk data within days using their existing Power BI environment and data models.